Heatmaps
See how users interact with every element on your page
Heatmaps show you how users are interacting with elements on your website or app. Visualize clicks, mouse movements, scrolling behavior, and discover where users get frustrated with rageclicks.
Three types of heatmaps
🔥 Heatmaps
Captures mouse movements, clicks, dead clicks, and rageclicks. Shows you a visual heatmap of all interactions - not just on clickable elements. See where users are trying to click, even when there's nothing to click on.
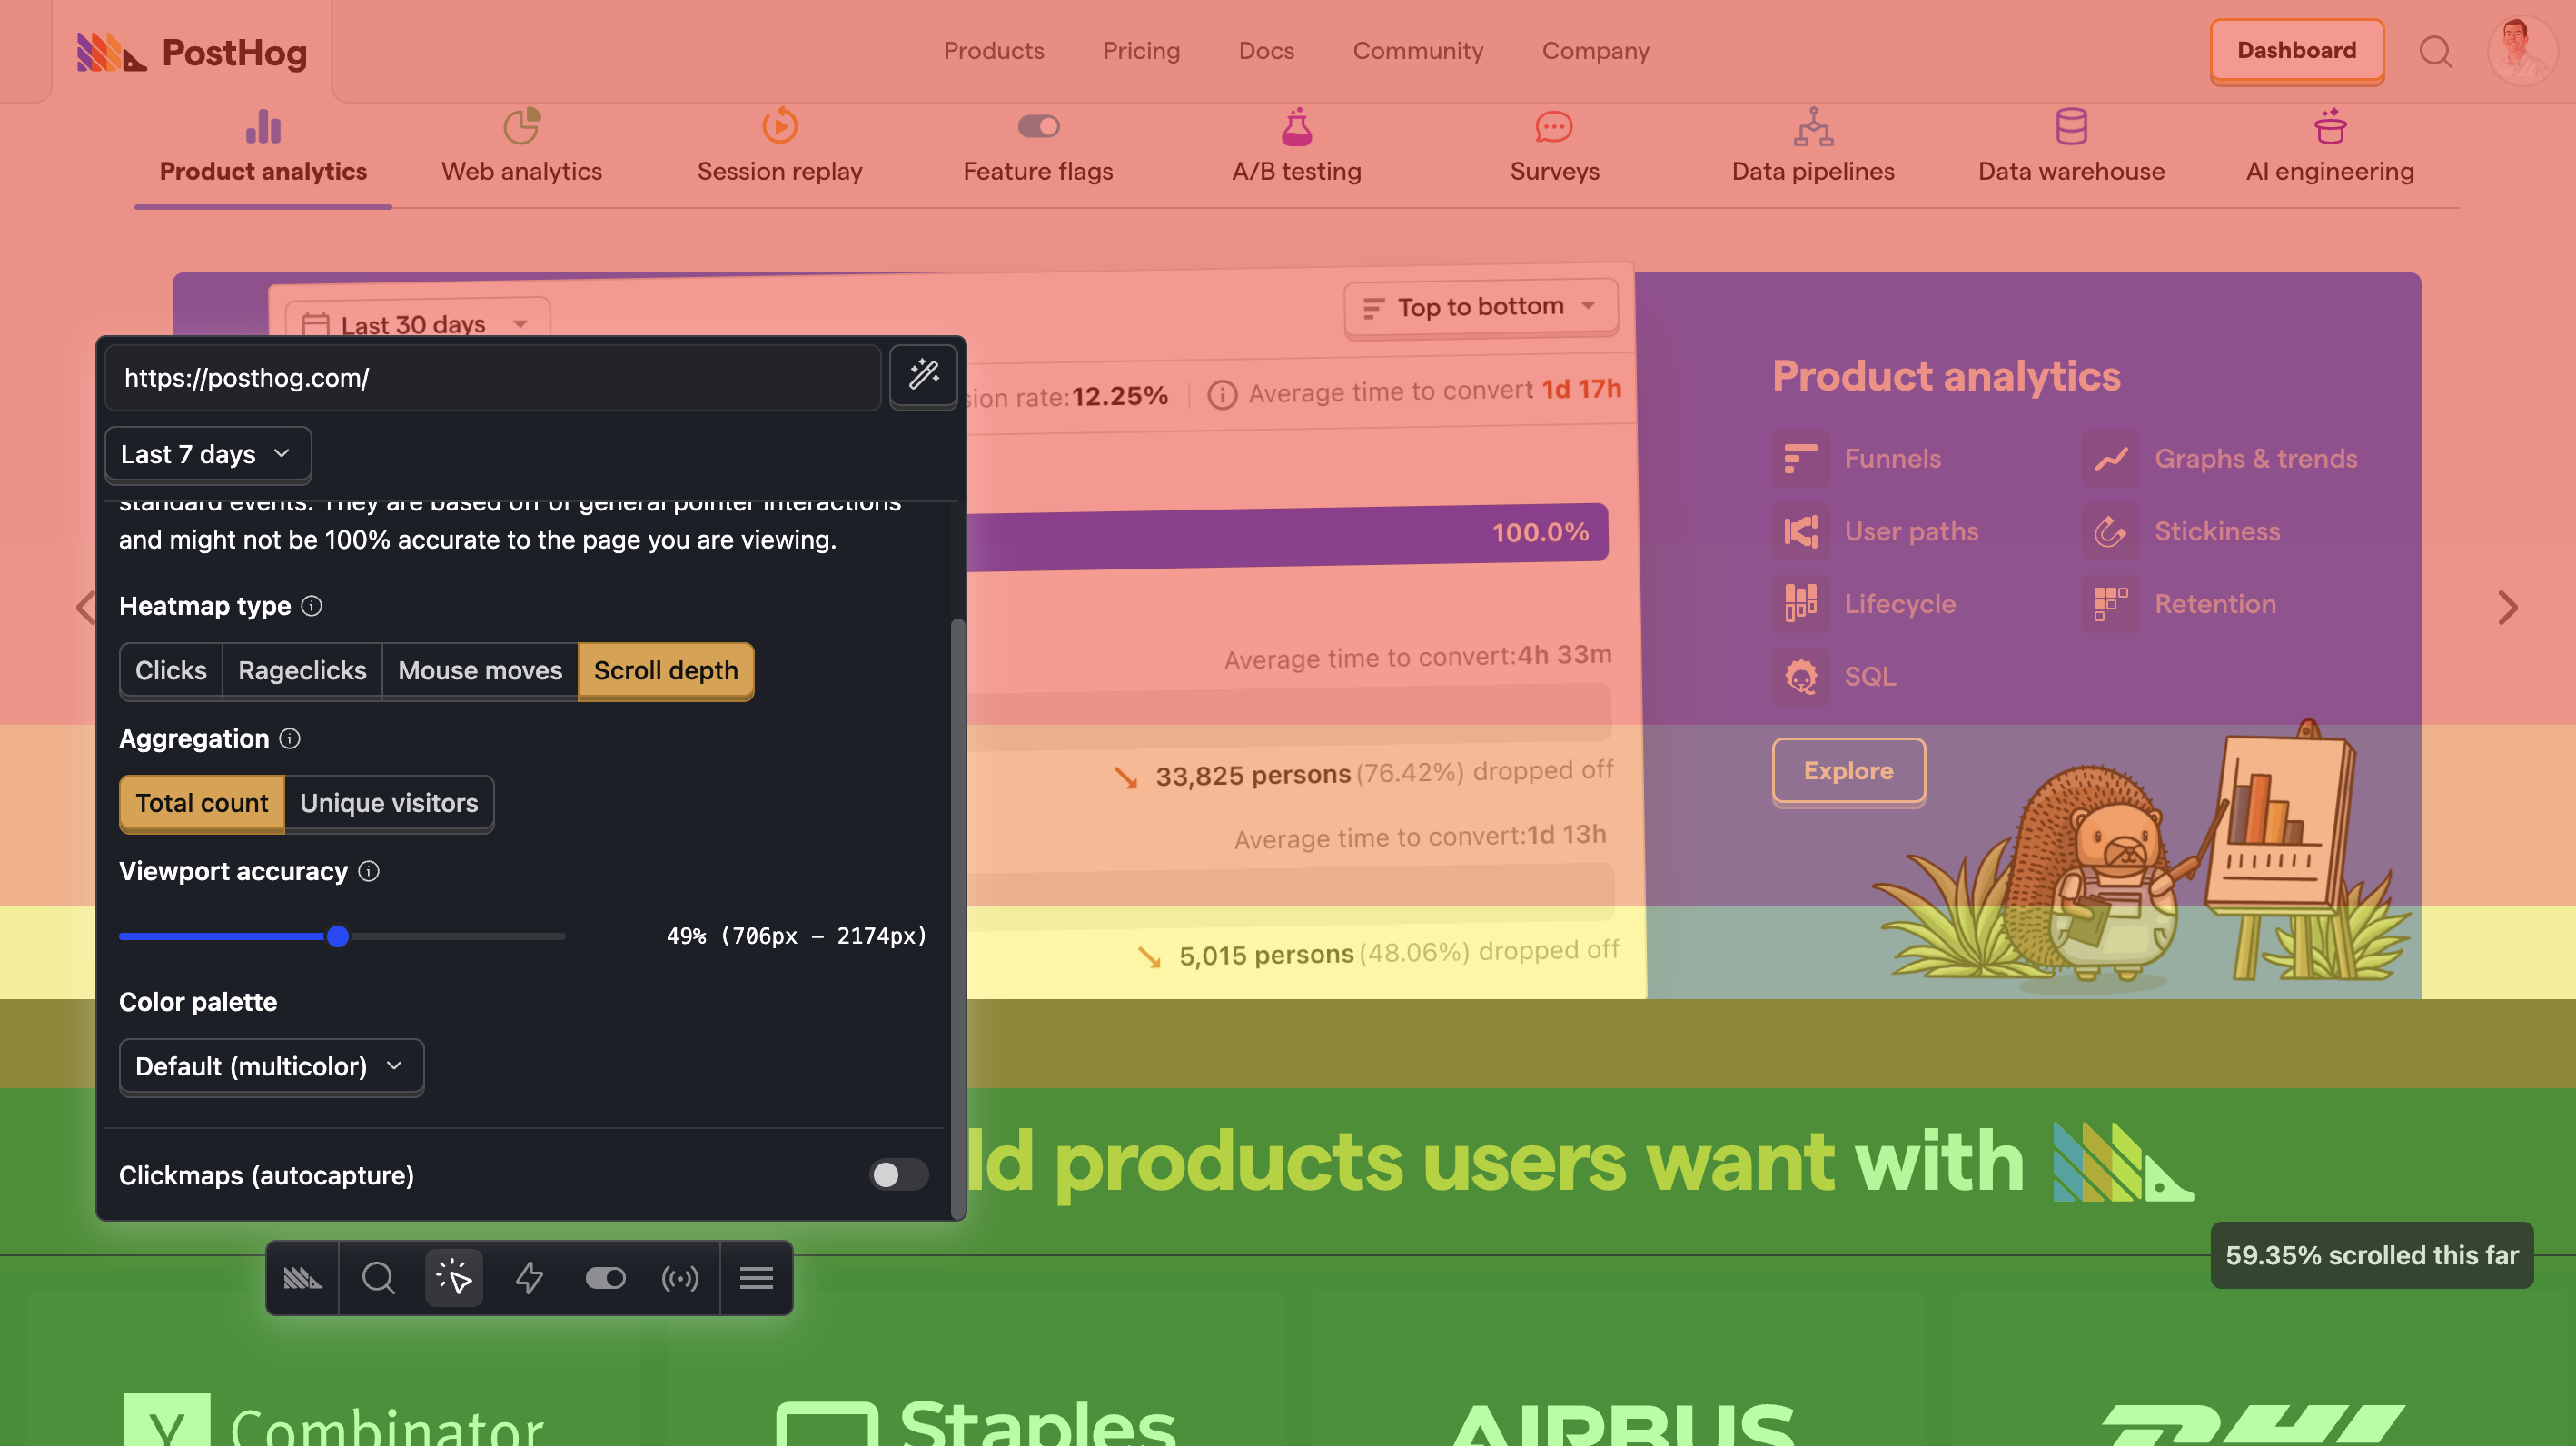
📜 Scrollmaps
Uses data from pageview and pageleave events to show how far down the page users are scrolling. Understand which content gets viewed and where users drop off.
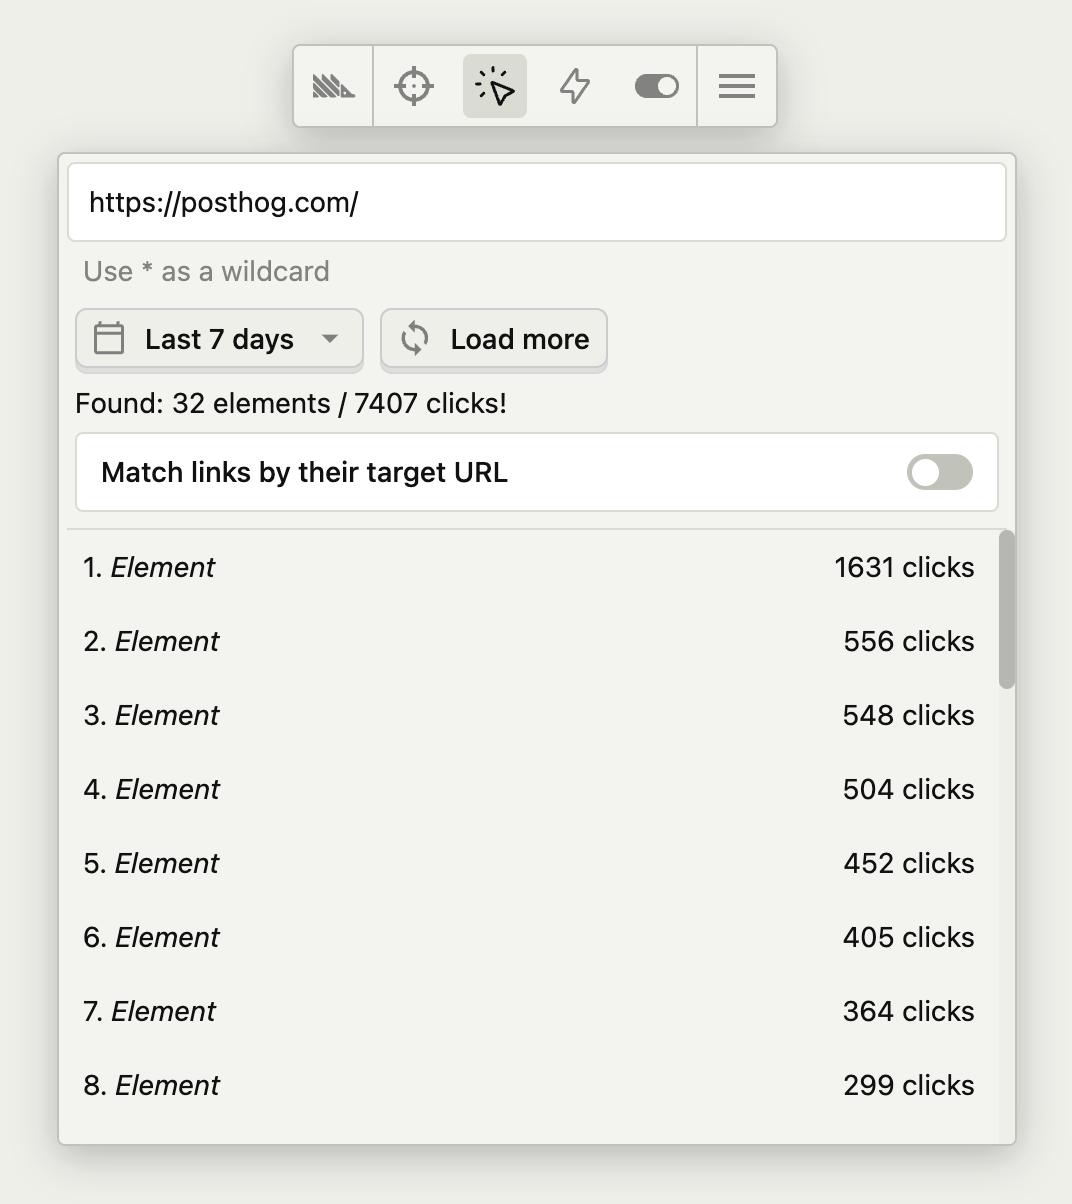
👆 Clickmaps
The OG heatmap. Uses autocapture to show exact click counts on specific clickable elements. Each element shows total clicks and rageclicks. Perfect for understanding which CTAs and links get the most attention.
Key features
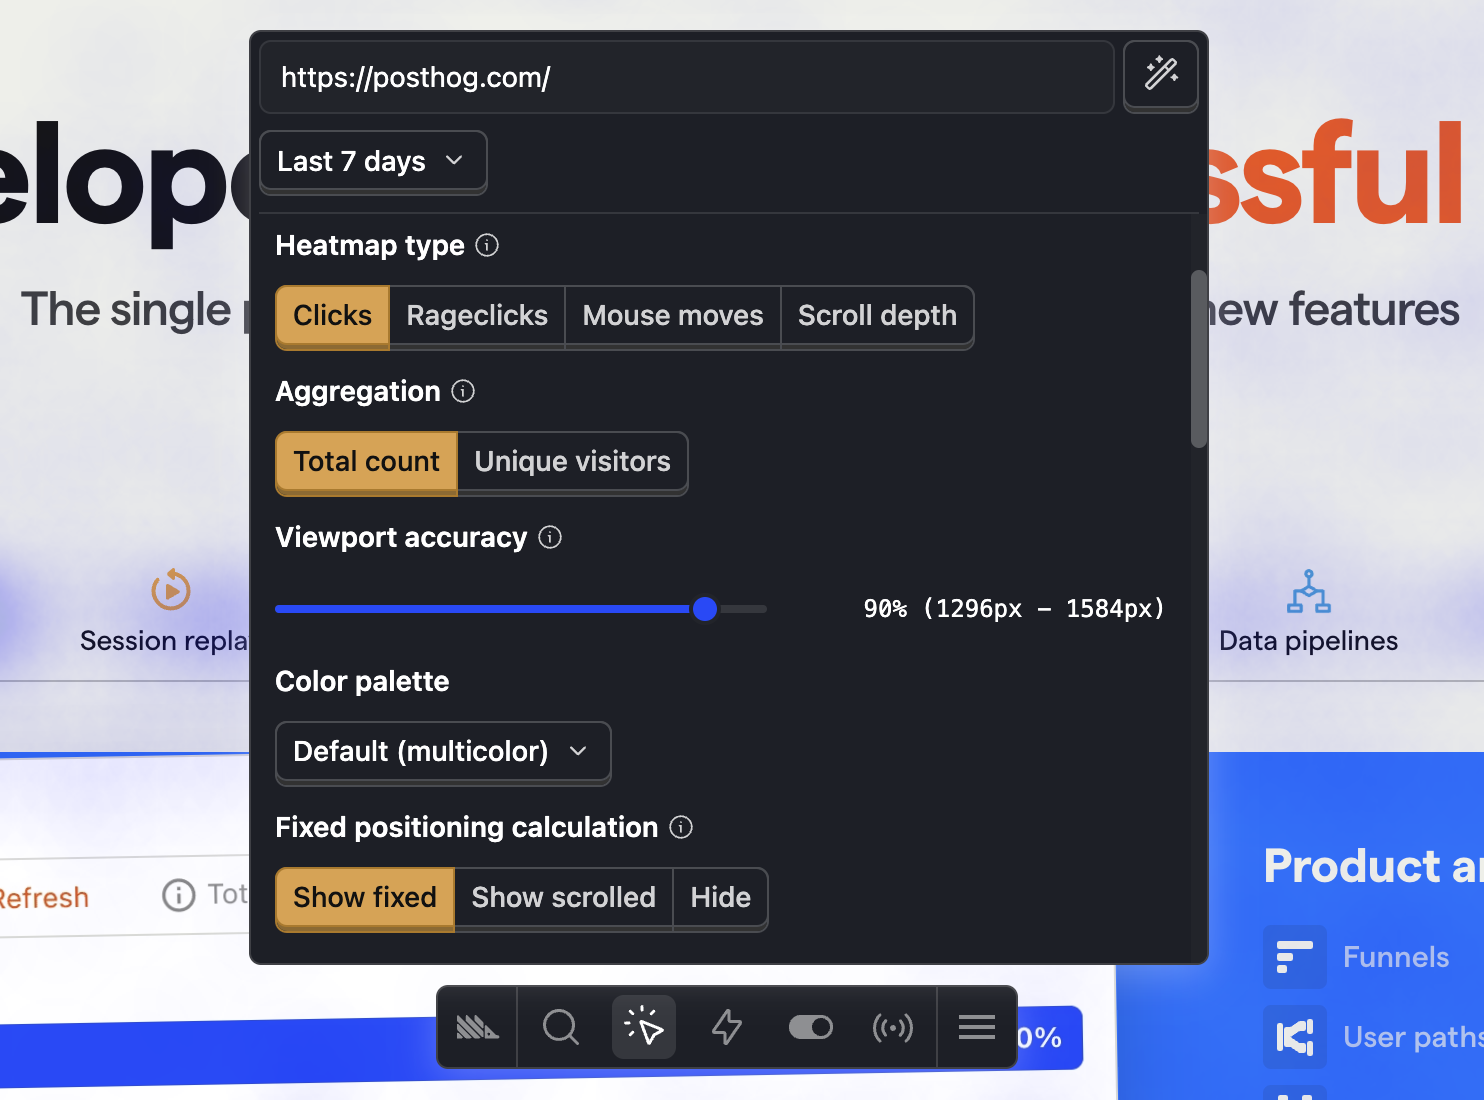
Flexible configuration
Customize your heatmap experience to match your needs:
- Aggregation: View by total events or unique users
- Viewport accuracy: Adjust tolerance for different screen sizes
- Color palettes: Choose gradients that work with your site design
- Fixed positioning: Handle fixed elements like headers correctly
Wildcard URL matching
Combine heatmap data from similar pages using wildcards. For example, use /products/* to see aggregated heatmaps across all product pages. Perfect for ecommerce sites and dynamic content.
Create actions from clicks
With the clickmap enabled, click any element to instantly create an action from it. Turn insights into trackable metrics without writing code.
Rageclick detection
Automatically detect user frustration. A rageclick is captured when users click the same element more than three times within one second - helping you identify confusing UI elements.
Match links by target URL
For dynamic lists, match clicks by their target URL instead of position. Understand which specific items get clicked, not just which position in the list.
No performance impact
Heatmap data is captured efficiently alongside regular analytics events. It doesn't contribute to your bill, and visualizations only render when you view them - your users never experience any slowdown.
Note: Clickmaps require autocapture to be enabled, and scrollmaps require pageleave events.
Getting started
Follow these steps to start using heatmaps in PostHog:
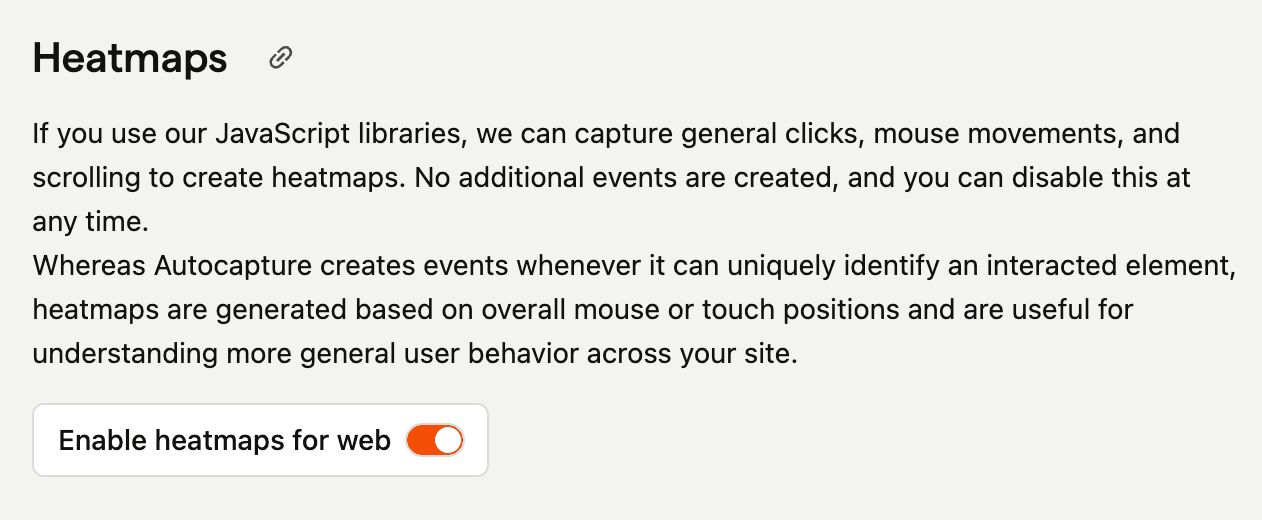
Enable heatmap data capture
Enable heatmap data capture in your project settings or with the enable_heatmaps key in your JavaScript SDK initialization.
View heatmaps two ways
Via Toolbar
- Install the PostHog toolbar on your site
- Click the heatmap icon in the toolbar to start viewing heatmaps
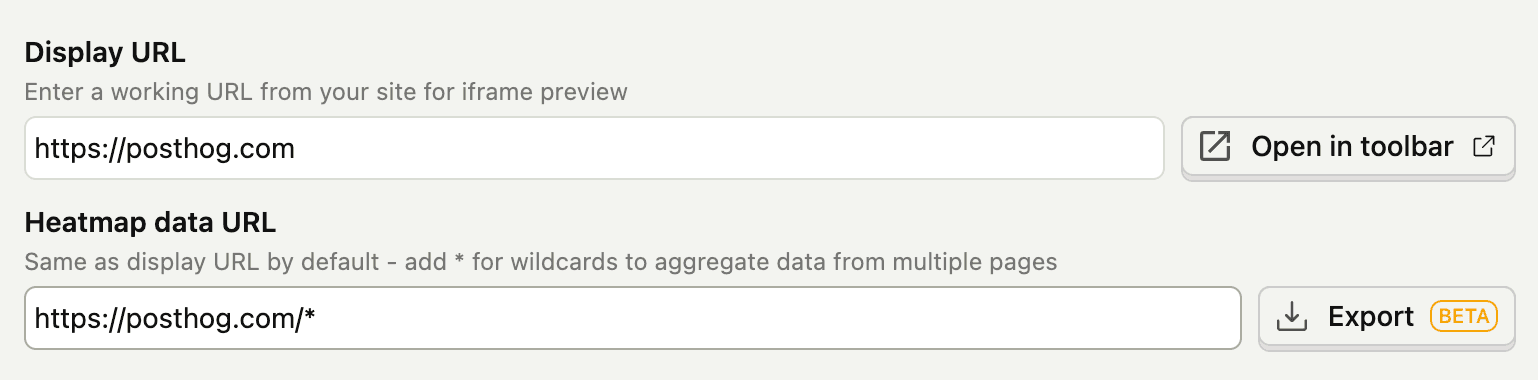
In PostHog App (beta)
- Open the Heatmaps product in PostHog
- Type the URL of your website in the "Display URL" field
- Optional: Use "Wildcard URL matching" for the "Heatmap data URL"