


The best Sentry alternatives & competitors, compared

Contents
1. PostHog
- Founded: 2020
- Similar to: Sentry, LogRocket
- Typical users: Engineers and product teams
- Typical customers: Mid-size B2Bs and startups
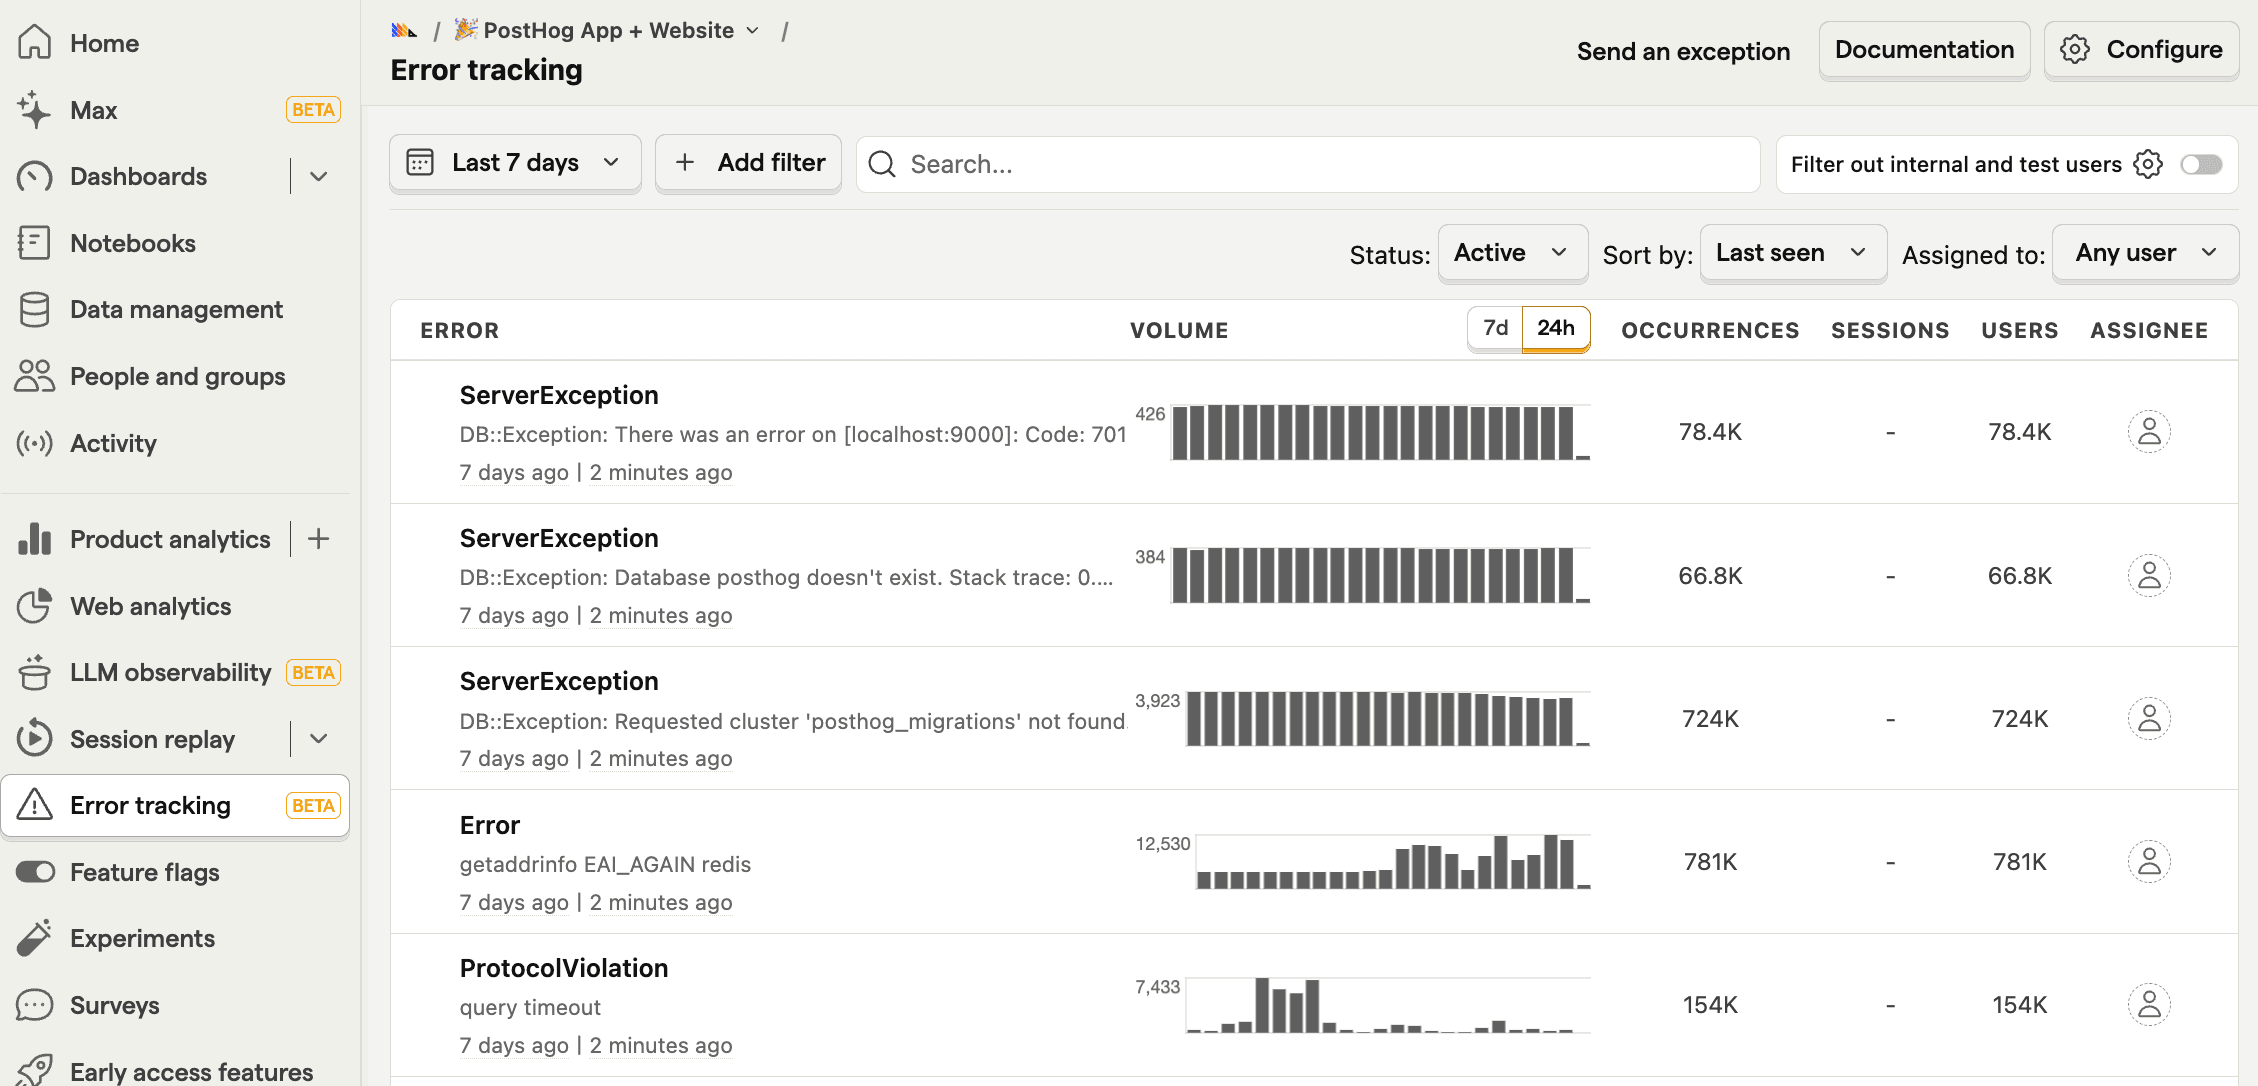
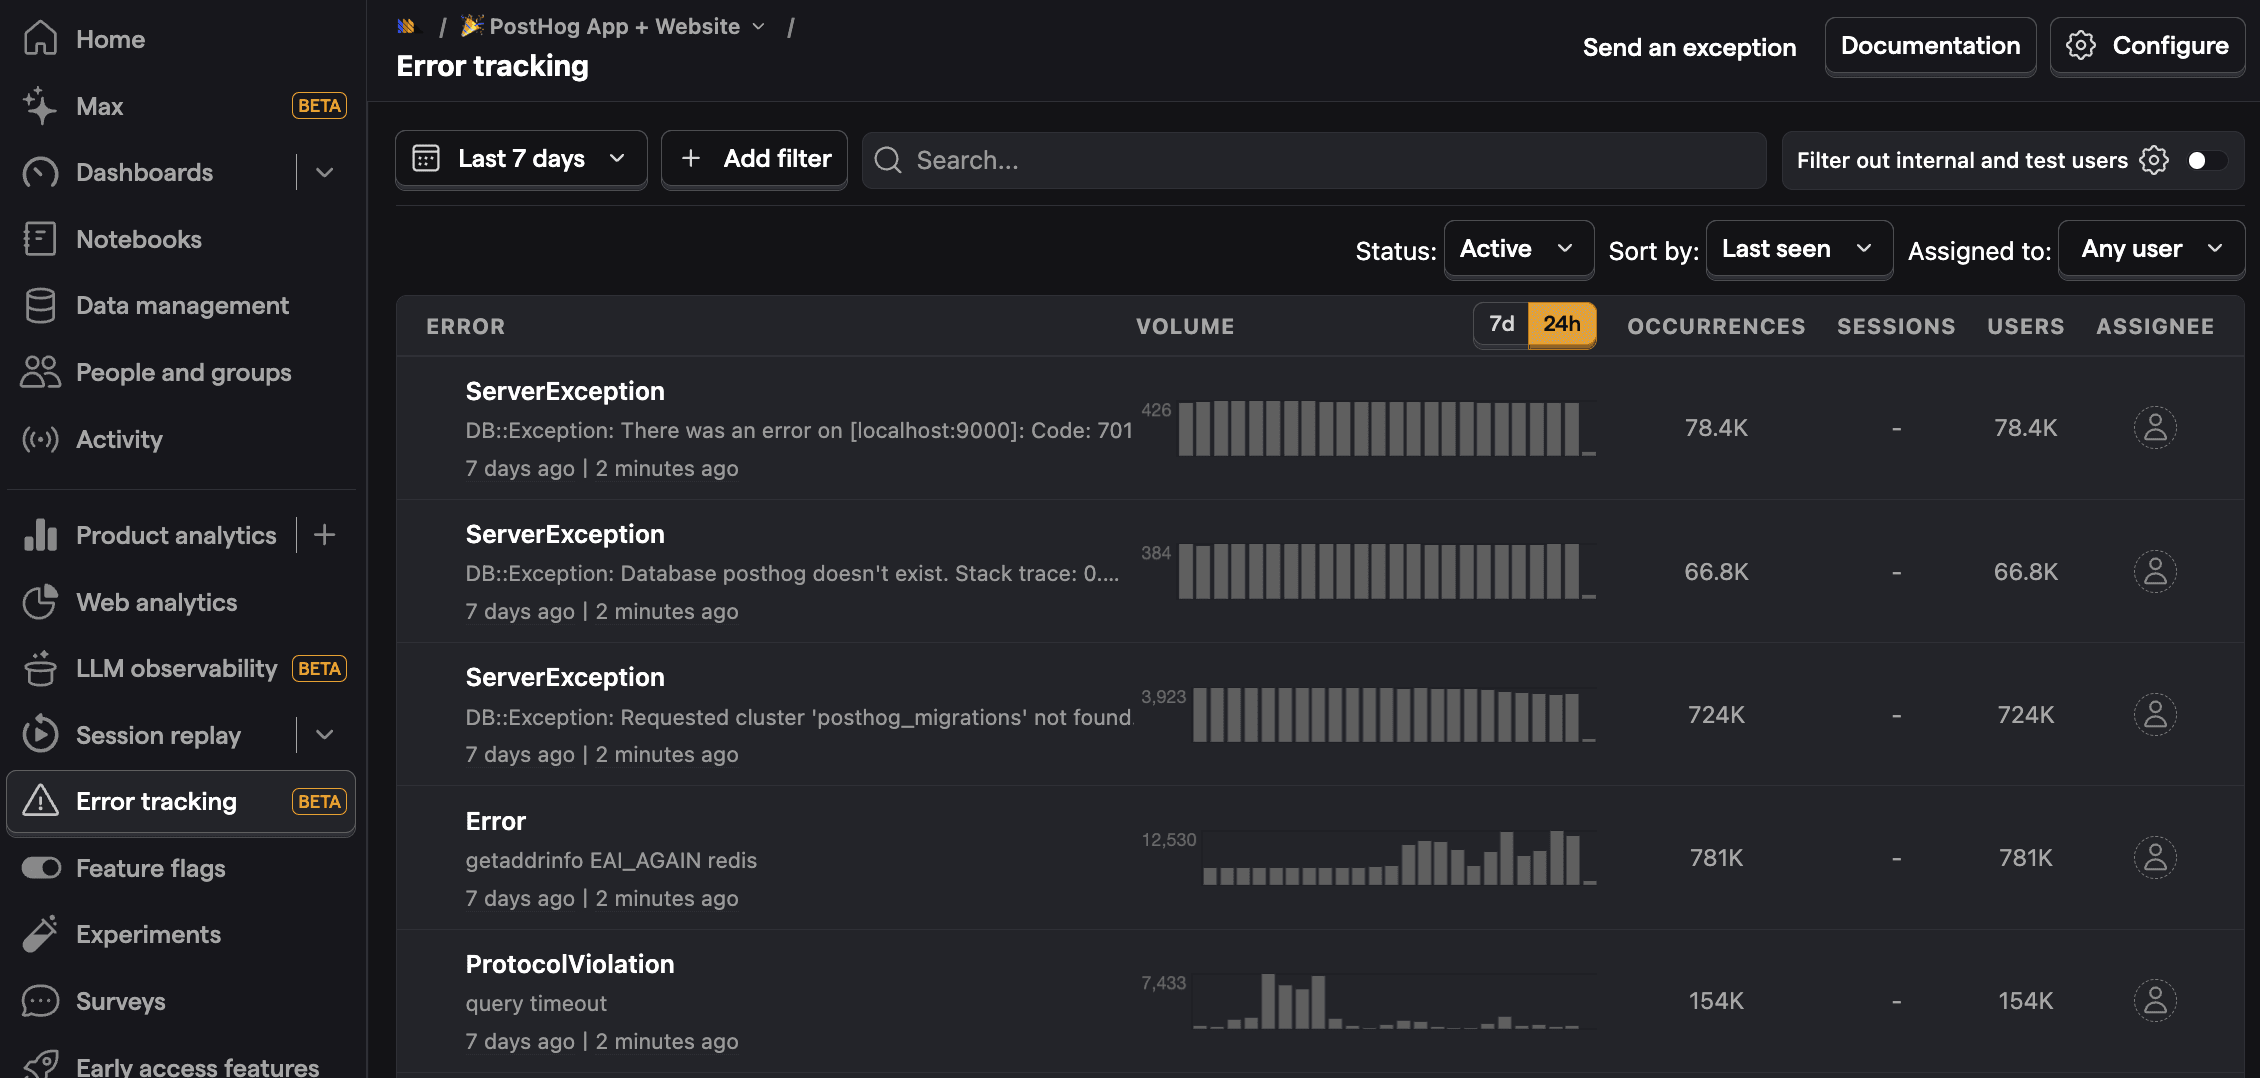
What is PostHog?
PostHog (that's us 👋) is an open-source platform combining error tracking, session replays, product analytics, A/B testing, feature flags, user surveys, and more into one product. This means it's not only an alternative to Sentry but also tools like Amplitude and LaunchDarkly.
According to BuiltWith, as of February 2025, 3,753 of the top 1 million websites deploy PostHog, far fewer than the 73,723 that use Sentry.
Key features
🚨 Error tracking: Capture errors and exceptions. Provide stack traces to debug issues. Correlate with product usage data.
📺 Session replays: View exactly how users are using your site. Includes event timelines, console logs, network activity, and 90-day data retention.
📈 Product analytics: Custom trends, funnels, user paths, retention analysis, and segment user cohorts. Also, direct SQL querying for power users.
🚩 Feature flags: Rollout features safely with local evaluation (for faster performance), JSON payloads, and instant rollbacks.
🧪 A/B tests: Optimize your app and website with up to nine test variations and track impact on primary and secondary metrics. Automatically calculate test duration, sample size, and statistical significance.
💬 Surveys: Target surveys by event or user properties. Templates for net promoter score (NPS), product-market fit (PMF) surveys, and more.
How does PostHog compare to Sentry?
| PostHog | Sentry | |
Self-serve Free to try, no mandatory sales calls | ✔ | ✔ |
Free tier Free forever option, no credit card required | ✔ | ✔ |
Error tracking Capture errors and exceptions, provide stack traces to debug issues | ✔ | ✔ |
Performance monitoring Monitor the performance of your app, including request latency, resource usage, and more | ✔ | ✔ |
Distributed tracing Follow a request across services to identify latency bottlenecks and inter-service dependencies. | ✖ | ✔ |
Profiling Capture detailed CPU, memory, and function-level performance metrics to pinpoint inefficient code segments. | ✖ | ✔ |
Alerting Detect and receive notifications when problems arise | ✔ | ✔ |
Release tracking Associate errors and performance issues with specific deployments | ✖ | ✔ |
Log management Aggregate and analyze logs in real-time to correlate events, identify issues, and gain insight into system performance. | ✖ | ✖ |
Product analytics Custom events, trends, funnels, paths, and retention | ✔ | ✖ |
Session replay Watch real users on your site; discover friction points | ✔ | ✔ |
Surveys Collect feedback and run satisfaction surveys | ✔ | Feedback only |
Governance Audit log, roles-based access, permissions | ✔ | Audit log, permissions |
Open source Audit code, contribute to roadmap, and build integrations | ✔ | ��✔ |
EU hosting Store your data in the EU for compliance | ✔ | ✔ |
Why do companies use PostHog?
According to reviews on G2, companies use PostHog because:
It replaces multiple tools: PostHog can replace Mixpanel (product analytics), Fullstory (session replay), and Optimizely (feature flags and A/B testing). This simplifies workflows and ensures product data is all in one place.
Pricing is transparent and scalable: Reviewers appreciate how PostHog's pricing scales as they grow. There's a generous free tier they can use forever. Companies eligible for PostHog for Startups also get $50k in additional free credits.
They need a complete picture of users: PostHog includes every tool necessary to understand users and improve products. This means creating funnels to track conversion, watching replays to see where users get stuck, testing solutions with A/B tests, gathering feedback with user surveys, and monitoring errors.
Bottom line
If you're looking for error tracking and session replay, along with many more tools for making your product better, PostHog is a great alternative to Sentry. This is especially the case for startups and scale ups, thanks to PostHog's generous free tier.
2. Rollbar
- Founded: 2012
- Similar to: Sentry, Appsignal, Raygun
- Typical users: Developers, engineers, and operations teams
- Typical customers: Enterprise organizations, SaaS companies, and tech startups
What is Rollbar?
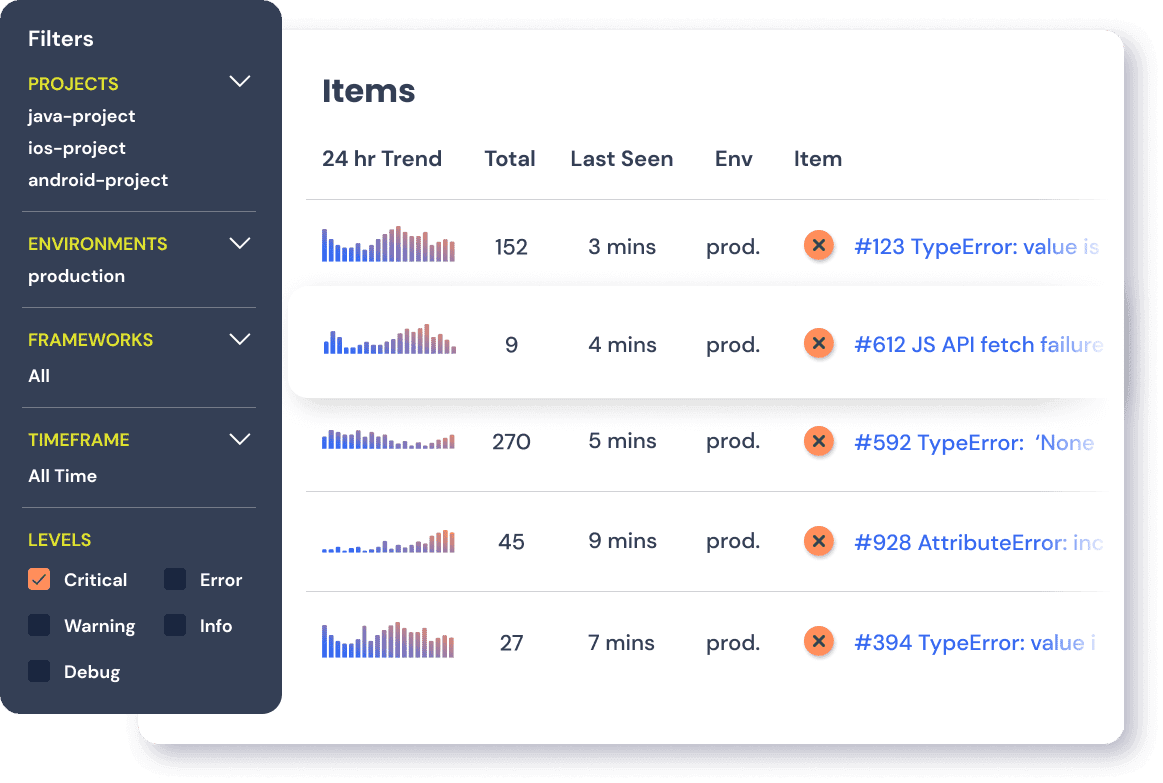
Rollbar helps teams find and fix errors in their code fast through real-time error tracking, issue management, and AI-assisted workflows. Their whole platform is designed to help teams quickly detect, prioritize, and resolve issues in their applications.
According to BuiltWith, as of February 2025, 4,485 of the top 1 million websites deploy Rollbar, compared to the 73,723 that use Sentry.
Key features
🪲 Error tracking: Real-time error detection with automatic grouping and issue tracking.
🚨 Alerting: Customizable alerting with notifications where you need them.
🔍 Error context: Detailed error context including stack traces, code, and telemetry.
🔄 Custom workflows: Use Rollbar's rules engine to trigger API or webhook-based actions.
How does Rollbar compare to Sentry?
| Rollbar | Sentry | |
Self-serve Free to try, no mandatory sales calls | ✔ | ✔ |
Free tier Free forever option, no credit card required | ✔ | ✔ |
Error tracking Capture errors and exceptions, provide stack traces to debug issues | ✔ | ✔ |
Performance monitoring Monitor the performance of your app, including request latency, resource usage, and more | ✖ | ✔ |
Distributed tracing Follow a request across services to identify latency bottlenecks and inter-service dependencies. | ✖ | ✔ |
Profiling Capture detailed CPU, memory, and function-level performance metrics to pinpoint inefficient code segments. | ✖ | ✔ |
Alerting Detect and receive notifications when problems arise | ✔ | ✔ |
Release tracking Associate errors and performance issues with specific deployments | ✔ | ✔ |
Log management Aggregate and analyze logs in real-time to correlate events, identify issues, and gain insight into system performance. | ✖ | ✖ |
Product analytics Custom events, trends, funnels, paths, and retention | ✖ | ✖ |
Session replay Watch real users on your site; discover friction points | ✖ | ✔ |
Surveys Collect feedback and run satisfaction surveys | ✖ | Feedback only |
Governance Audit log, roles-based access, permissions | Audit on enterprise plans | Audit log, permissions |
Open source Audit code, contribute to roadmap, and build integrations | ✖ | ✔ |
EU hosting Store your data in the EU for compliance | ✖ | ✔ |
Why do companies use Rollbar?
According to reviews on G2, companies choose Rollbar for its:
Ease-of-use: Reviewers like that Rollbar makes it easy to track and monitor errors to ensure their apps are running smoothly.
Integrations: Rollbar integrates with the tools reviewers already use like Slack, GitHub, Jira, and more.
Customer support: Reviewers appreciate Rollbar's responsiveness to support requests and feedback.
Bottom line
If Sentry is too complex or expensive for your needs, Rollbar might be a great alternative to try.
3. Raygun
- Founded: 2007
- Similar to: Sentry, Rollbar
- Typical users: Development teams and SREs
- Typical customers: Ecommerce and media companies
What is Raygun?
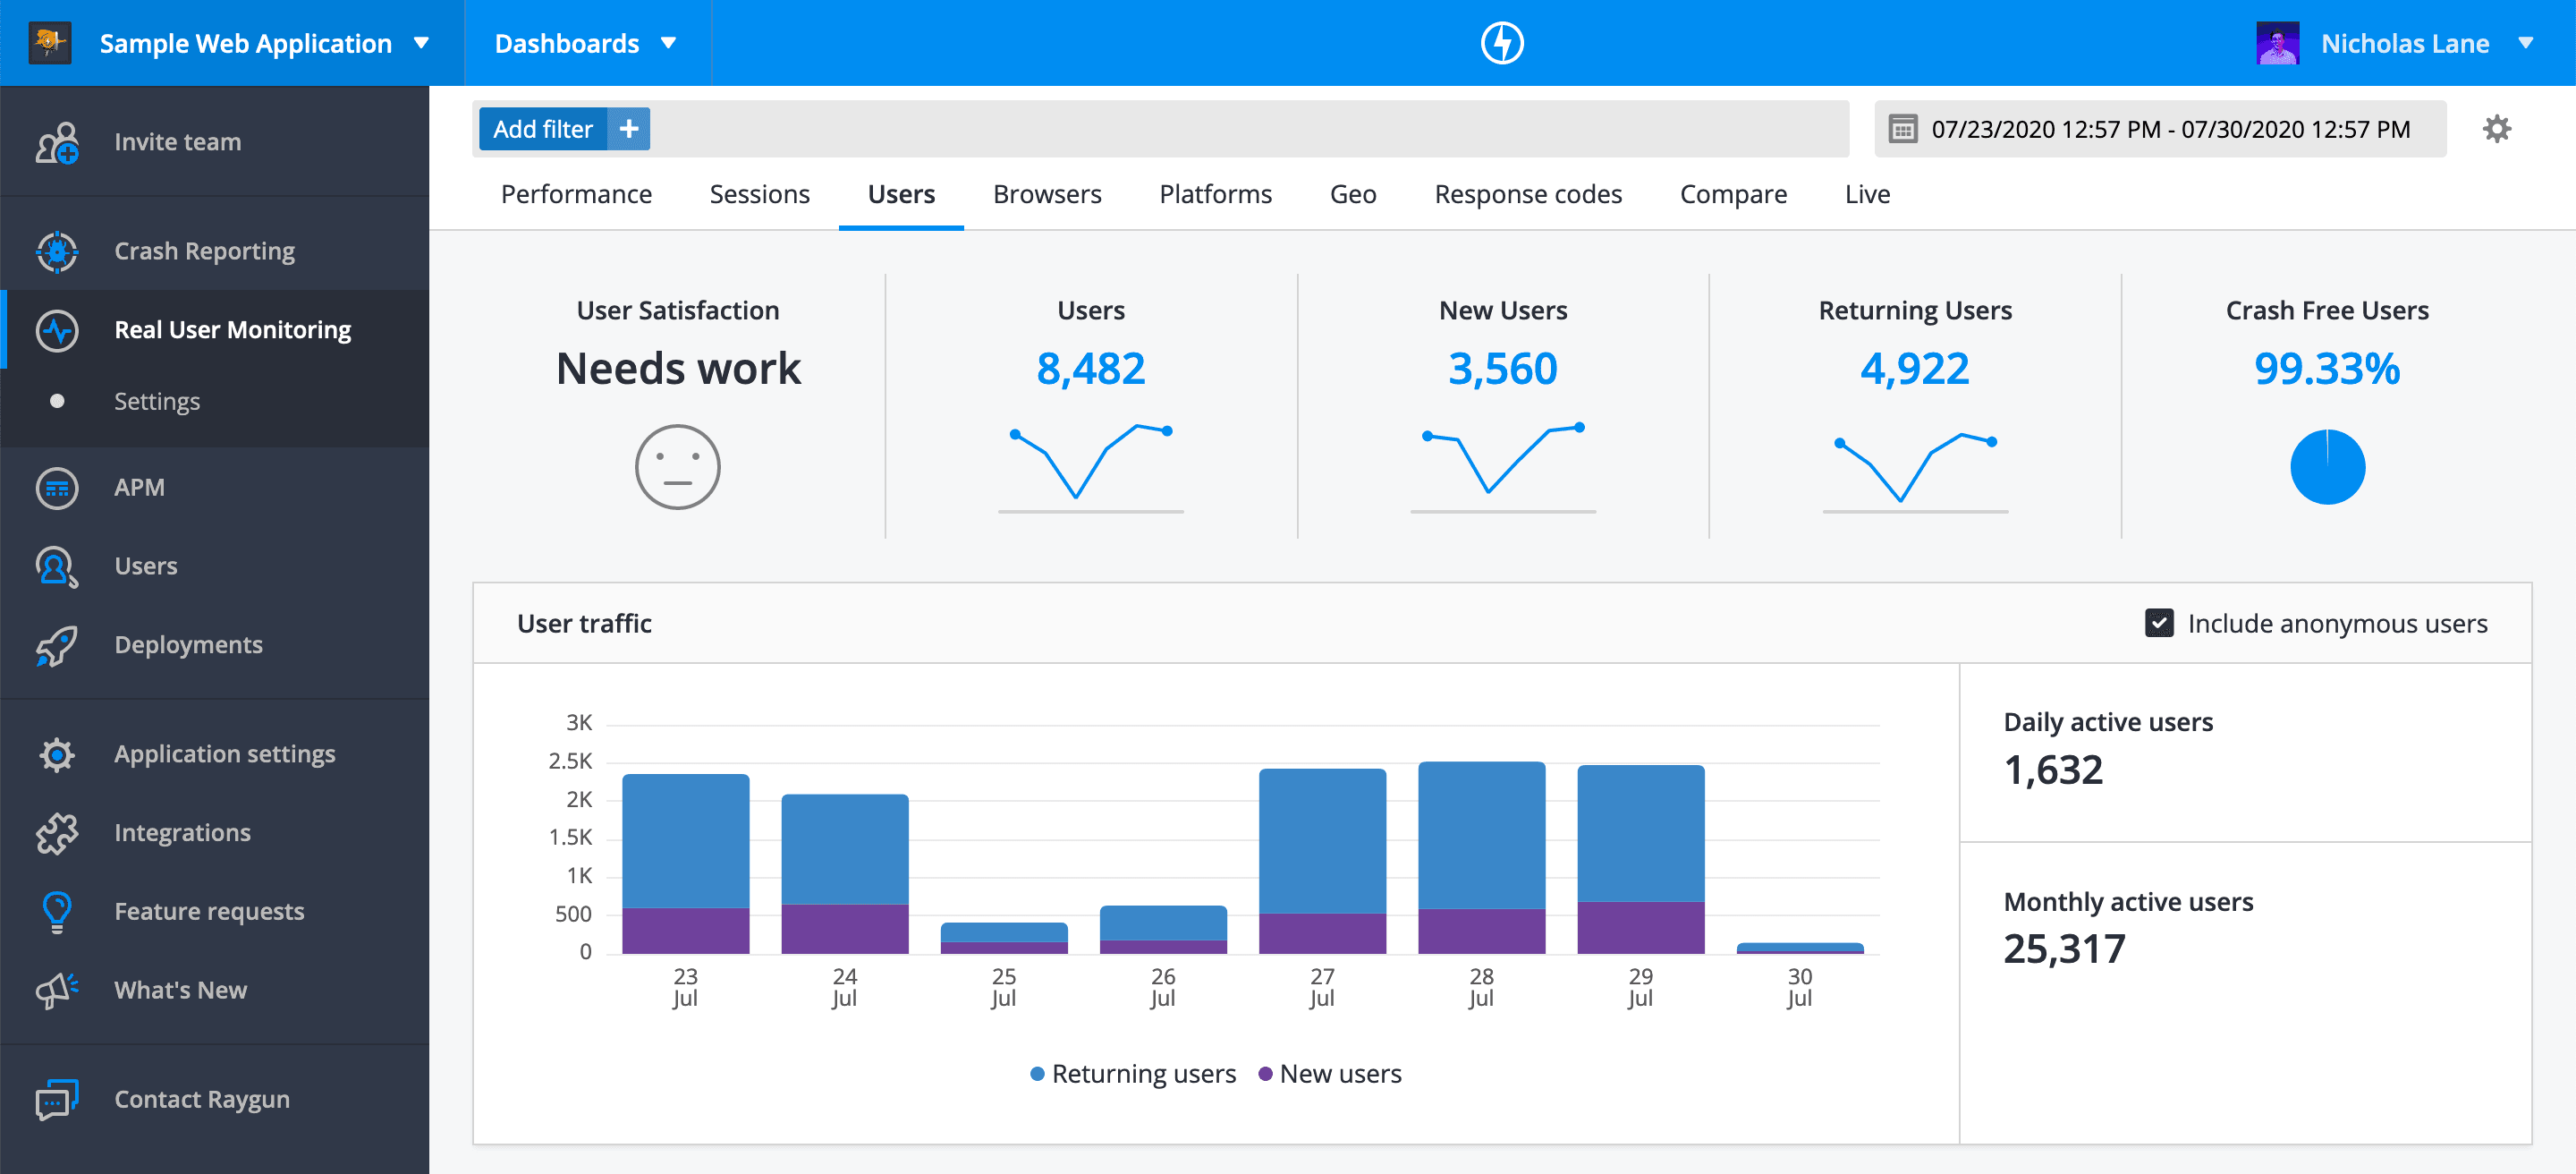
Raygun is a full-stack monitoring platform focused on ecommerce and media companies.
It provides crashing reporting, performance monitoring, and user experience insights. Its suite of tools enables teams to quickly detect, diagnose, and resolve issues across their entire tech stack. It's also built an AI error resolution system to help with this.
According to BuiltWith, as of February 2025, only 504 of the top 1 million websites deploy Raygun.
Key features
🪲 Error tracking: Real-time error and crash reporting with detailed stack traces and code-level insights.
📈 Performance monitoring: Get insights into your app's performance for your users. Track metrics like Core Web Vitals and load times.
📺 Application performance monitoring: Uncover backend performance issues with tracing and visualizations.
🧠 AI error resolution: Raygun's suite of tools has AI error resolution built in to make all of this easier.
How does Raygun compare to Sentry?
| Raygun | Sentry | |
Self-serve Free to try, no mandatory sales calls | ✔ | ✔ |
Free tier Free forever option, no credit card required | ✖ | ✔ |
Error tracking Capture errors and exceptions, provide stack traces to debug issues | ✔ | ✔ |
Performance monitoring Monitor the performance of your app, including request latency, resource usage, and more | ✔ | ✔ |
Distributed tracing Follow a request across services to identify latency bottlenecks and inter-service dependencies. | ✔ | ✔ |
Profiling Capture detailed CPU, memory, and function-level performance metrics to pinpoint inefficient code segments. | ✖ | ✔ |
Alerting Detect and receive notifications when problems arise | ✔ | ✔ |
Release tracking Associate errors and performance issues with specific deployments | ✔ | ✔ |
Log management Aggregate and analyze logs in real-time to correlate events, identify issues, and gain insight into system performance. | ✖ | ✖ |
Product analytics Custom events, trends, funnels, paths, and retention | ✖ | ✖ |
Session replay Watch real users on your site; discover friction points | ✖ | ✔ |
Surveys Collect feedback and run satisfaction surveys | ✖ | Feedback only |
Governance Audit log, roles-based access, permissions | Audit log, permissions | Audit log, permissions |
Open source Audit code, contribute to roadmap, and build integrations | ✖ | ✔ |
EU hosting Store your data in the EU for compliance | ✖ | ✔ |
Why do companies use Raygun?
According to G2 reviews, Raygun is chosen because:
Alerting: Reviewers like that Raygun helps them stay on top of issues in real-time. This helps them maintain a high level of satisfaction.
Stack traces: Raygun helps reviewers find the exact code or request that is causing an issue. Grouping also helps them figure out which issues are causing the most pain.
Simplicity: Compared to other tools, reviewers find Raygun easier to set up and use. They appreciate the UI Raygun has built.
Bottom line
If you're looking for a simple tool to do error tracking and performance monitoring, Raygun is one to try out. Their lack of a free tier makes them harder to recommend for small projects though.
4. Datadog
- Founded: 2010
- Similar to: New Relic
- Typical users: DevOps teams, IT, and software engineers
- Typical customers: Huge, cloud-native enterprises
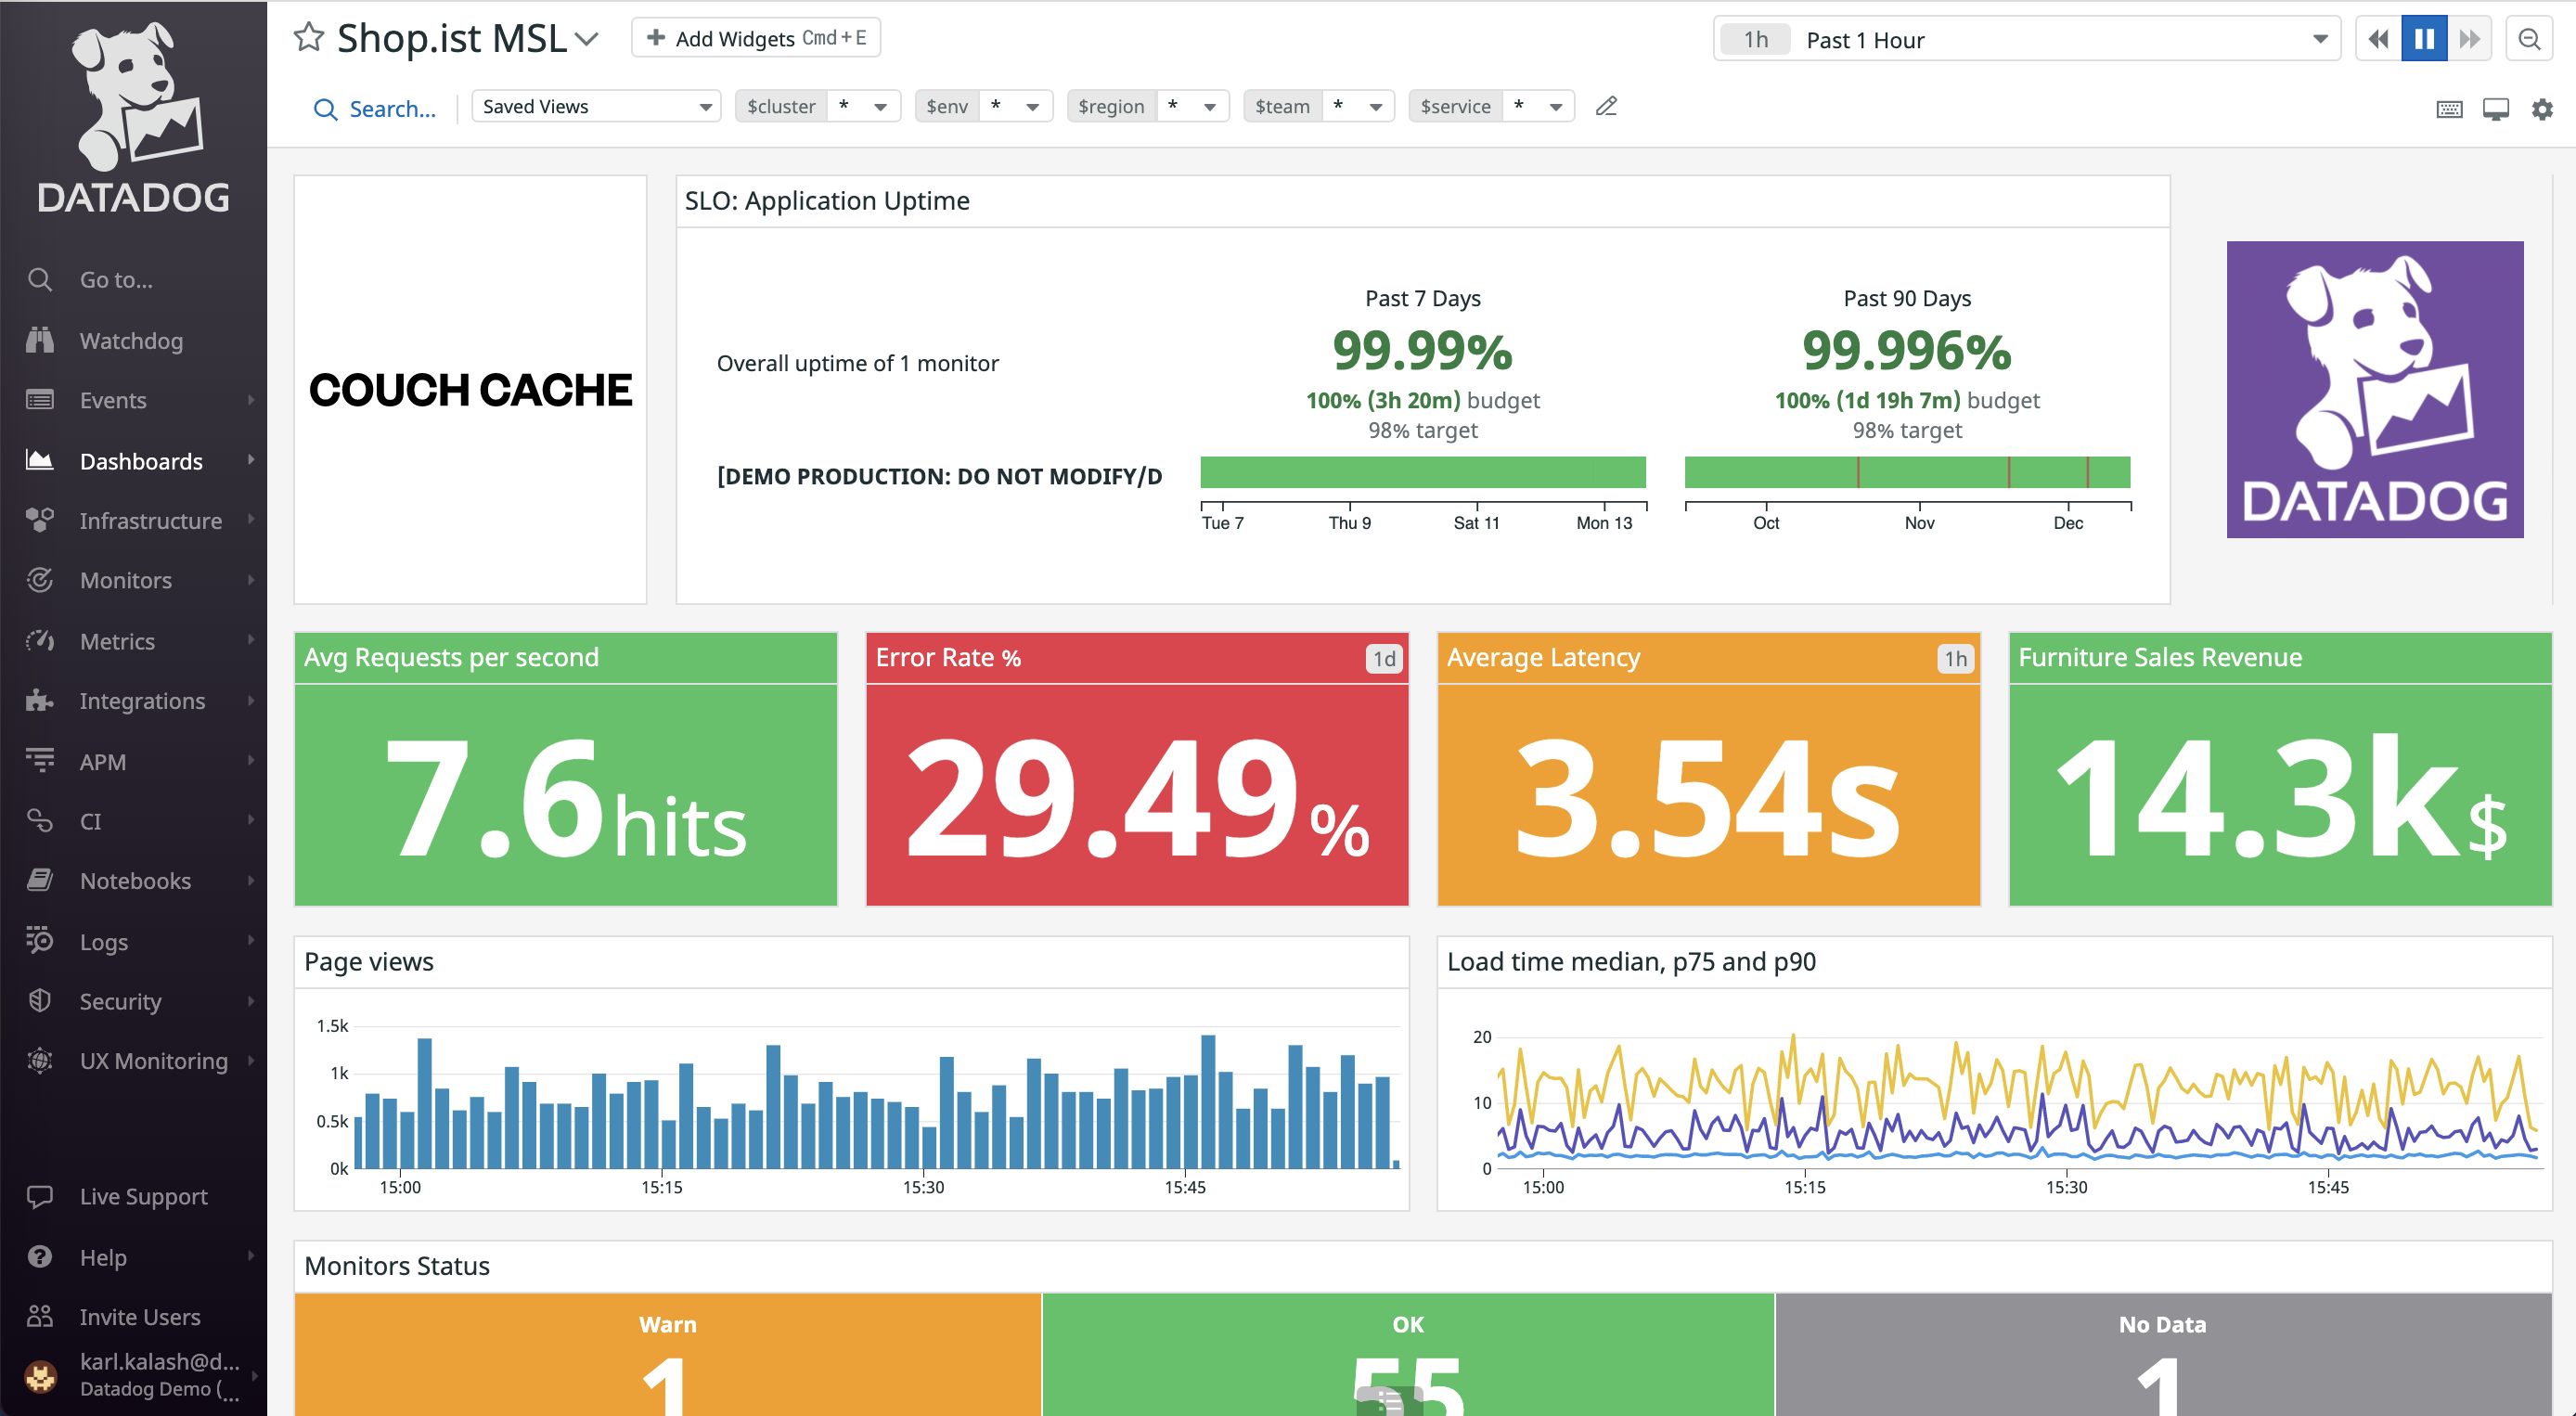
What is Datadog?
Datadog is a cloud observability and monitoring platform that provides real-time visibility into infrastructure, applications, logs, and network performance. It enables organizations to ensure performance, security, and reliability across their entire stack.
According to BuiltWith, as of February 2025, only 4,941 of the top 1 million websites deploy Datadog compared to 73,723 that use Sentry, but this likely underestimates the number of users as much of Datadog's usage is in backend systems.
Key features
📈 Performance monitoring: Monitor your app (and infrastructure) performance across your stack, from frontend to workflows to databases. Troubleshoot issues with distributed tracing.
📝 Log management: Aggregate and analyze logs in real-time to correlate events, identify issues, and gain insight into system performance.
👷 Infrastructure monitoring: Get visibility into your infrastructure's performance, health, and security across your cloud or hybrid environment.
🔒 Security and compliance monitoring: Ensure your data is secure and compliant with industry standards. Protect against reported vulnerabilities.
How does Datadog compare to Sentry?
| Datadog | Sentry | |
Self-serve Free to try, no mandatory sales calls | ✔ | ✔ |
Free tier Free forever option, no credit card required | ✖ | ✔ |
Error tracking Capture errors and exceptions, provide stack traces to debug issues | ✔ | ✔ |
Performance monitoring Monitor the performance of your app, including request latency, resource usage, and more | ✔ | ✔ |
Distributed tracing Follow a request across services to identify latency bottlenecks and inter-service dependencies. | ✔ | ✔ |
Profiling Capture detailed CPU, memory, and function-level performance metrics to pinpoint inefficient code segments. | ✔ | ✔ |
Alerting Detect and receive notifications when problems arise | ✔ | ✔ |
Release tracking Associate errors and performance issues with specific deployments | ✔ | ✔ |
Log management Aggregate and analyze logs in real-time to correlate events, identify issues, and gain insight into system performance. | ✔ | ✖ |
Product analytics Custom events, trends, funnels, paths, and retention | ✖ | ✖ |
Session replay Watch real users on your site; discover friction points | ✔ | ✔ |
Surveys Collect feedback and run satisfaction surveys | ✖ | Feedback only |
Governance Audit log, roles-based access, permissions | ✔ | Audit log, permissions |
Open source Audit code, contribute to roadmap, and build integrations | ✖ | ✔ |
EU hosting Store your data in the EU for compliance | ✔ | ✔ |
Note: Although Datadog has a free tier, its 1 day data retention is not enough for real usage.
Why do companies use Datadog?
According to G2 reviewers, Datadog is chosen because:
Multi-product: From infrastructure monitoring to application performance monitoring to log management, Datadog has products for nearly every part of your stack. Reviewers also appreciate that all these products are interconnected.
Integrations: Reviewers claim that Datadog has integrations for "literally everything." This means it can hook into nearly every tool they use.
Depth: The amount of data Datadog can collect is huge. Along with their range of analysis tools, reviewers find it's super customizable to their needs.
Bottom line
For huge enterprises, Datadog is likely already on your monitoring radar. The main complaint is the cost, which might make other tools more appealing, especially for smaller teams.
5. New Relic
- Founded: 2008
- Similar to: Datadog
- Typical users: Engineers, DevOps, SREs, and IT Ops
- Typical customers: Enterprises, mid-market technology companies, and cloud-native organizations
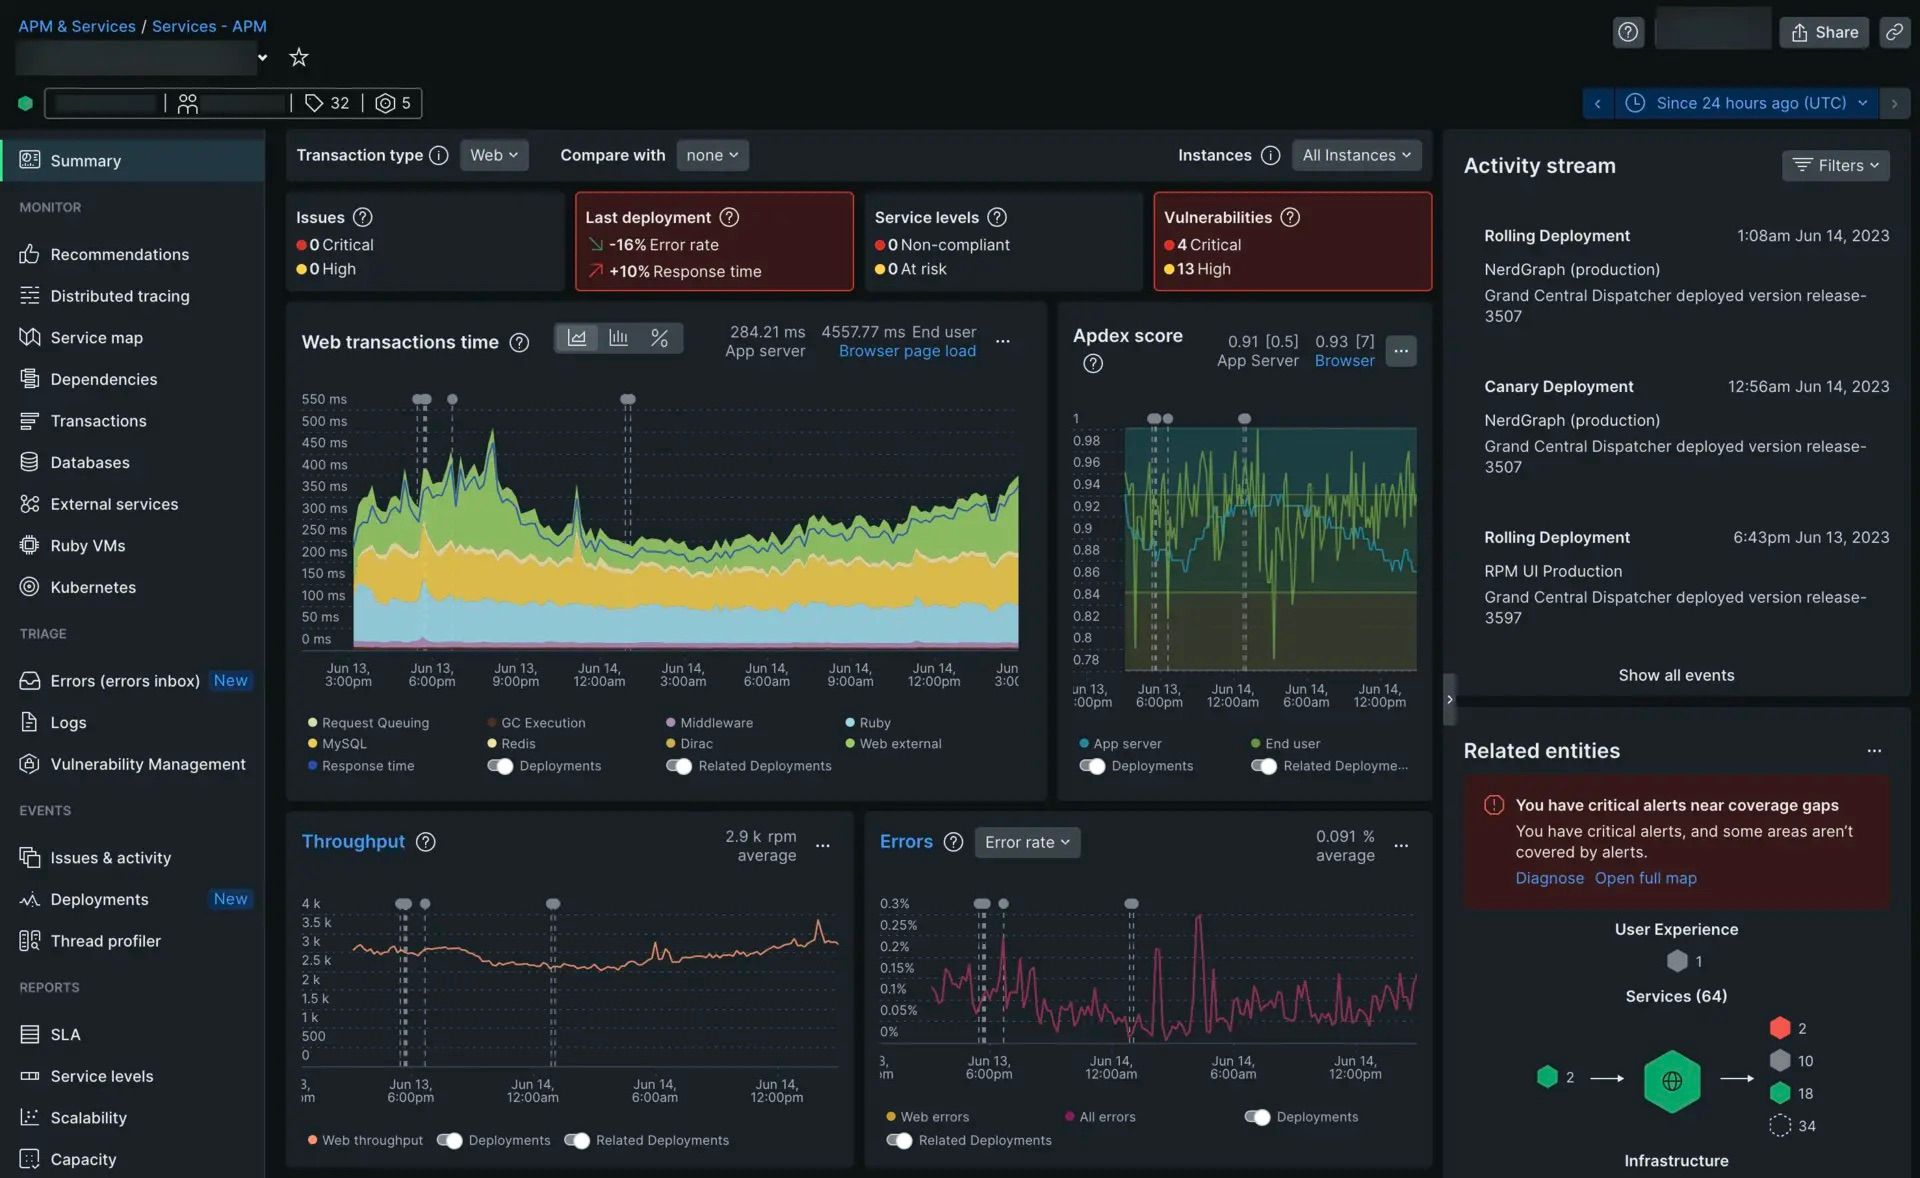
What is New Relic?
New Relic is a cloud-based observability and analytics platform that provides full-stack visibility into application performance, infrastructure, and user experience. It helps organizations monitor, troubleshoot, and optimize their software in real time, enabling proactive issue resolution and improved customer experiences.
According to BuiltWith, as of February 2025, 40,714 of the top 1 million websites deploy New Relic, closest of any of the alternatives on this list to the 73,723 that use Sentry.
Key features
🔍 Full-stack observability: Monitor applications, infrastructure, and digital experiences across your entire stack
📊 Real-time monitoring: Track performance and errors with AI-powered insights and analysis
📝 Log management: Aggregate and analyze logs with distributed tracing for quick troubleshooting
🔌 Integrations: Connect with over 780 tools and open source ecosystems
💰 Flexible pricing: Usage-based pricing model with a free tier, makes it cheaper to get started with (than Datadog)
How does New Relic compare to Sentry?
| New Relic | Sentry | |
Self-serve Free to try, no mandatory sales calls | ✔ | ✔ |
Free tier Free forever option, no credit card required | ✔ | ✔ |
Error tracking Capture errors and exceptions, provide stack traces to debug issues | ✔ | ✔ |
Performance monitoring Monitor the performance of your app, including request latency, resource usage, and more | ✔ | ✔ |
Distributed tracing Follow a request across services to identify latency bottlenecks and inter-service dependencies. | ✔ | ✔ |
Profiling Capture detailed CPU, memory, and function-level performance metrics to pinpoint inefficient code segments. | ✔ | ✔ |
Alerting Detect and receive notifications when problems arise | ✔ | ✔ |
Release tracking Associate errors and performance issues with specific deployments | ✔ | ✔ |
Log management Aggregate and analyze logs in real-time to correlate events, identify issues, and gain insight into system performance. | ✔ | ✖ |
Product analytics Custom events, trends, funnels, paths, and retention | ✖ | ✖ |
Session replay Watch real users on your site; discover friction points | ✔ | ✔ |
Surveys Collect feedback and run satisfaction surveys | ✖ | Feedback only |
Governance Audit log, roles-based access, permissions | ✔ | Audit log, permissions |
Open source Audit code, contribute to roadmap, and build integrations | ✔ | ✔ |
EU hosting Store your data in the EU for compliance | ✔ | ✔ |
Why do companies use New Relic?
G2 reviewers like New Relic because:
It's all-in-one: Reviewers find that New Relic provides all the functionality they need to monitor their apps and infrastructure, as well as find issues and solve them.
It's easy to get started: Reviewers praise New Relic for how easy it is to set up and its pre-built queries and dashboards. This helps them get started quickly and transition into more complex use cases when needed.
Bottom line
New Relic is similar to Datadog: it has a ton of observability and monitoring features (along with the added bonus of a free tier). Definitely one to consider for enterprise DevOps and SRE teams.
6. LogRocket
- Founded: 2016
- Similar to: PostHog
- Typical users: Product managers, engineers, support teams
- Typical customers: B2B SaaS, B2C retail companies
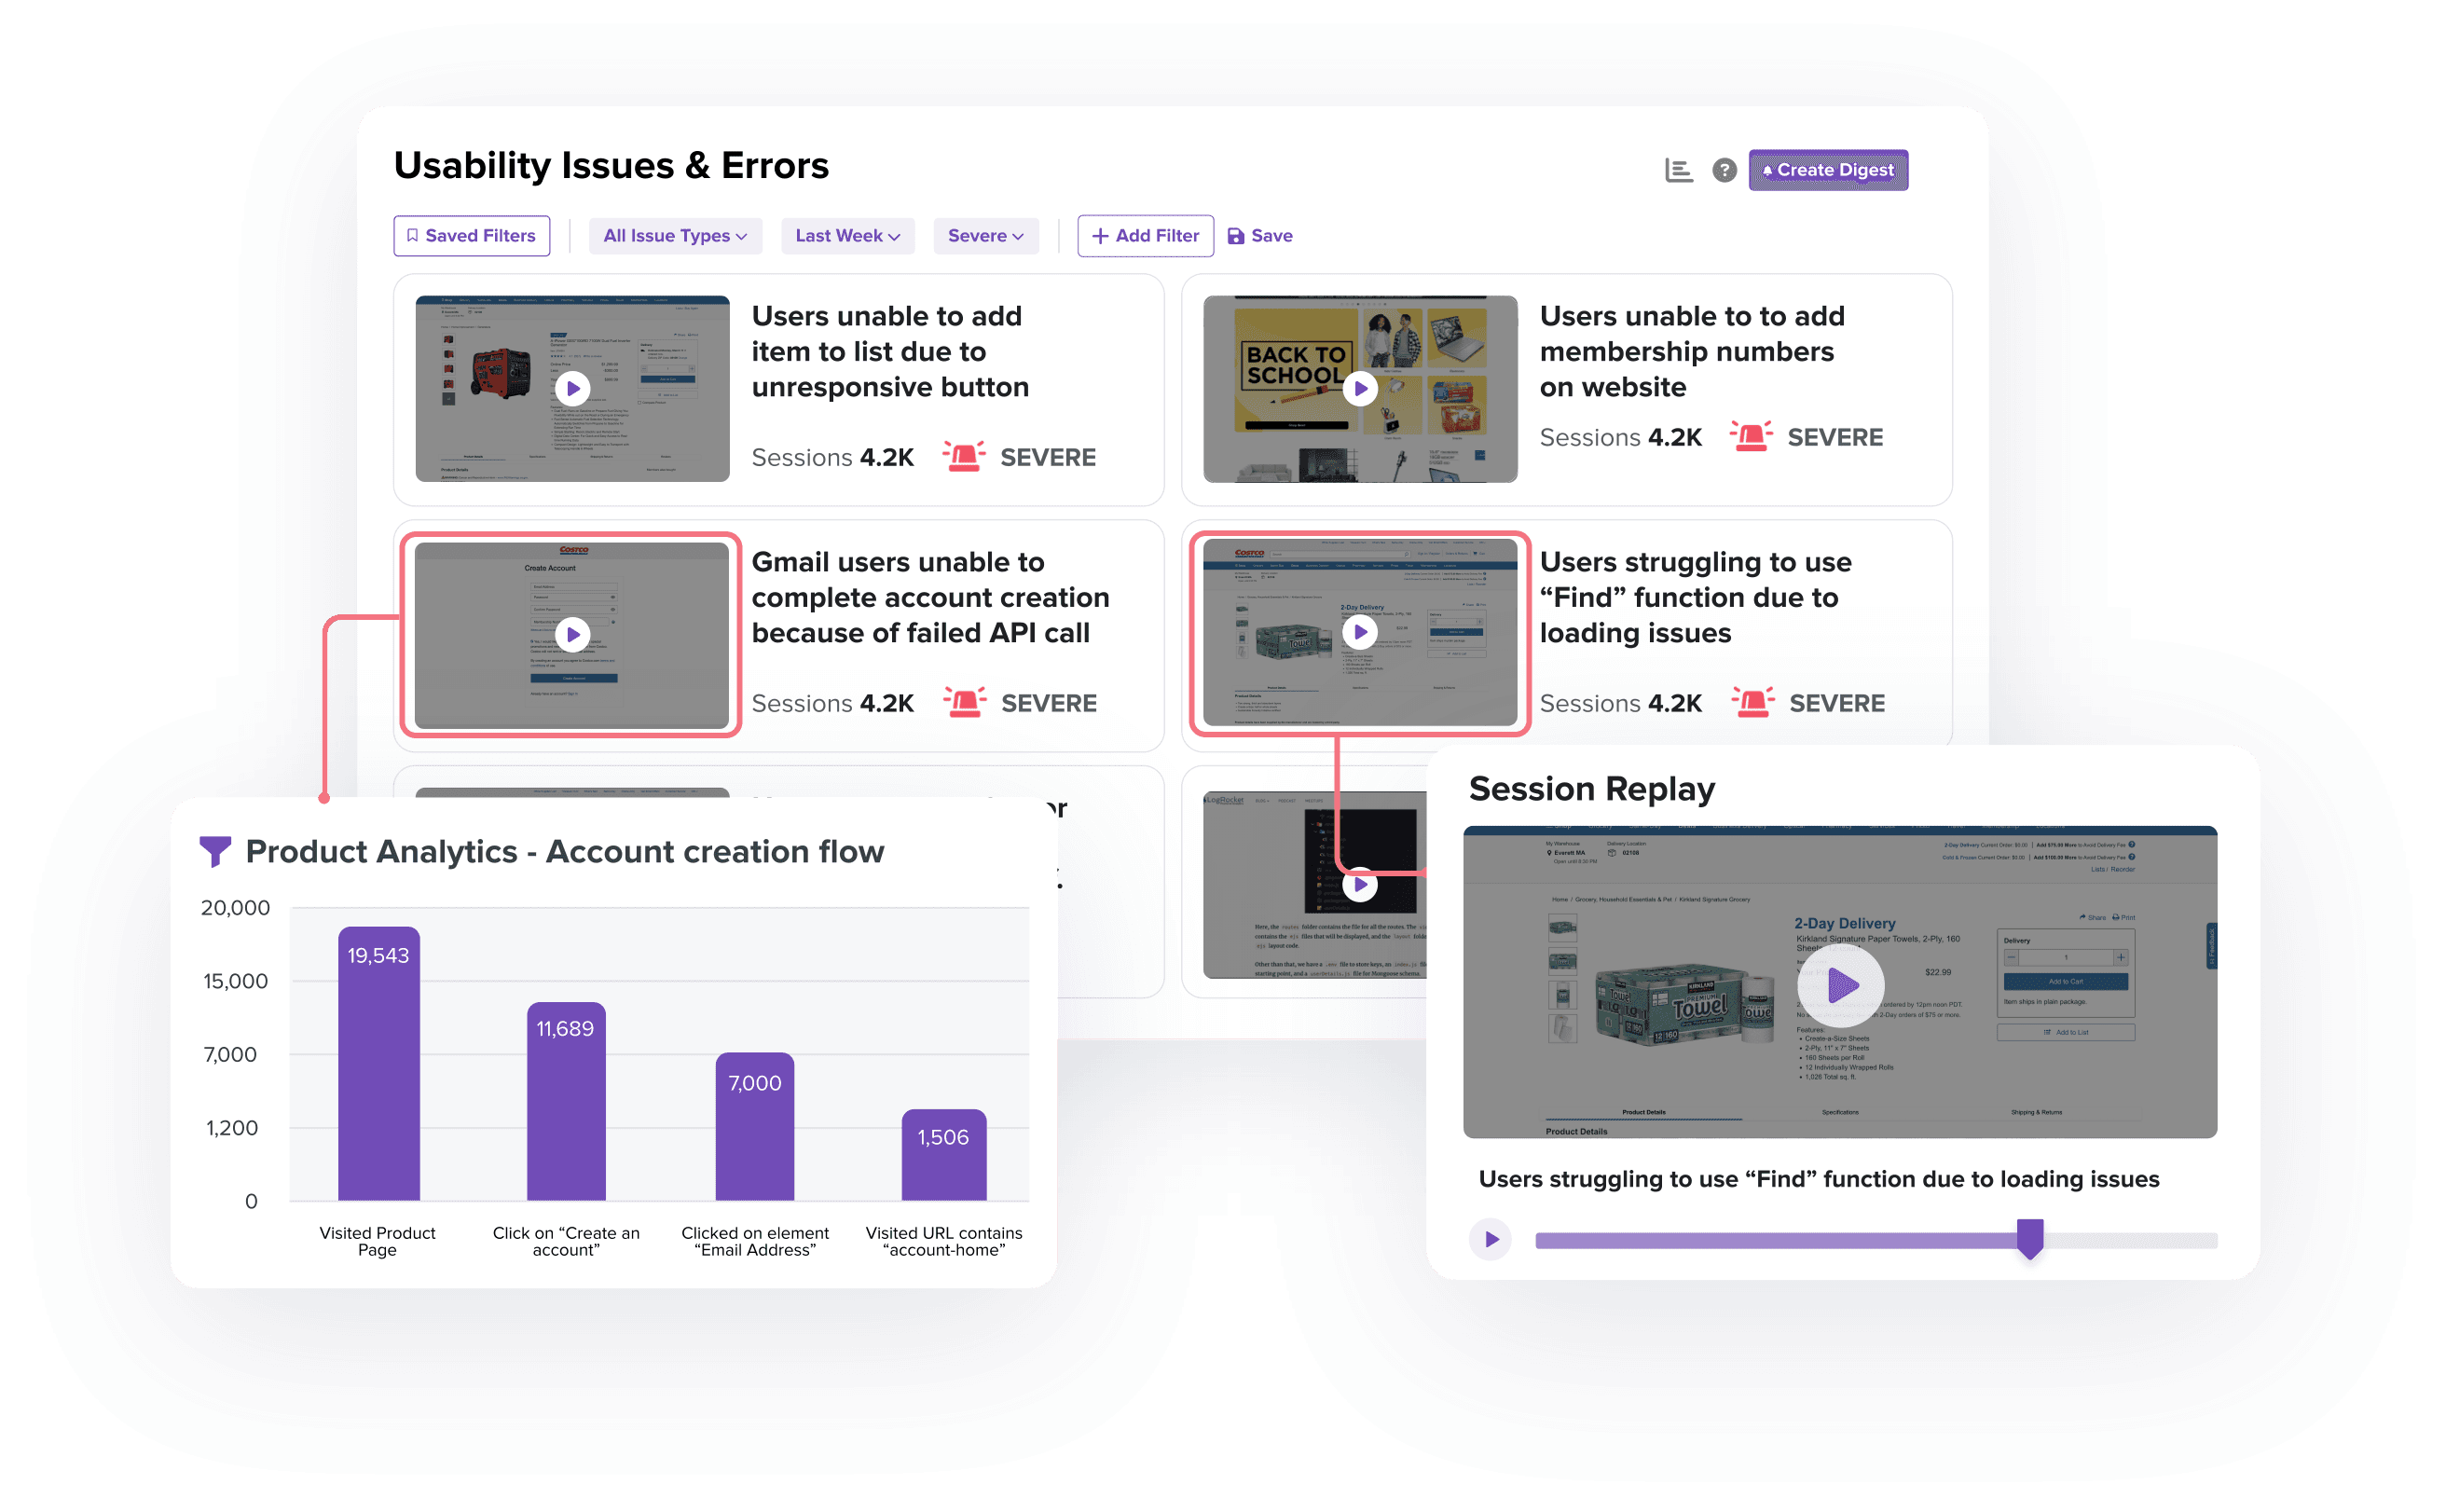
What is LogRocket?
LogRocket is a product experience platform with product analytics, error tracking, session replay, and performance monitoring. It focuses on helping product managers, engineers, and support teams identify and fix issues.
According to BuiltWith, as of February 2025, 2,525 of the top 1 million websites deploy LogRocket far from the 73,723 that use Sentry.
Key features
🚨 Error tracking: Identify and triage the most impactful issues with JavaScript and network errors as well as stack traces.
📹 Session replay: Understand exactly what users are doing on your site. See the screens they visit, places they click, as well as console and network logs, errors, and performance data.
🏎️ Performance monitoring: Monitor frontend performance such as web vitals, CPU and memory usage, and network speed.
📈 Product analytics: Capture usage data and visualize it with conversion funnels, path analysis, and retention charts.
How does LogRocket compare to Sentry?
| LogRocket | Sentry | |
Self-serve Free to try, no mandatory sales calls | ✔ | ✔ |
Free tier Free forever option, no credit card required | ✔ | ✔ |
Error tracking Capture errors and exceptions, provide stack traces to debug issues | ✔ | ✔ |
Performance monitoring Monitor the performance of your app, including request latency, resource usage, and more | ✔ | ✔ |
Distributed tracing Follow a request across services to identify latency bottlenecks and inter-service dependencies. | ✖ | ✔ |
Profiling Capture detailed CPU, memory, and function-level performance metrics to pinpoint inefficient code segments. | ✖ | ✔ |
Alerting Detect and receive notifications when problems arise | ✔ | ✔ |
Release tracking Associate errors and performance issues with specific deployments | ✖ | ✔ |
Log management Aggregate and analyze logs in real-time to correlate events, identify issues, and gain insight into system performance. | ✖ | ✖ |
Product analytics Custom events, trends, funnels, paths, and retention | ✔ | ✖ |
Session replay Watch real users on your site; discover friction points | ✔ | ✔ |
Surveys Collect feedback and run satisfaction surveys | ✔ | Feedback only |
Governance Audit log, roles-based access, permissions | ✔ | Audit log, permissions |
Open source Audit code, contribute to roadmap, and build integrations | ✖ | ✔ |
EU hosting Store your data in the EU for compliance | ✖ | ✔ |
Why do companies use LogRocket?
According to G2 reviews, customers use LogRocket because:
Identifying problems: LogRocket's combination of error tracking, performance monitoring, and session replay makes it uniquely powerful at finding bugs and issues. Unlike other tools, it uncovers both user and software issues.
Improves user experience: LogRocket seems to have succeeded at their goal of helping users fix issues. Reviewers find it provides all the tools to improve their user experience.
Usability: LogRocket provides a lot of functionality out of the box. It captures the details users need, provides useful visualizations, and automatically triages some issues.
Bottom line
LogRocket, like PostHog, is focused more engineering, product and support teams. It's a good alternative to Sentry for these types of teams.
7. AppSignal
- Founded: 2012
- Similar to: Sentry, Raygun
- Typical users: Developers and DevOps teams
- Typical customers: Startups and mid-sized SaaS companies
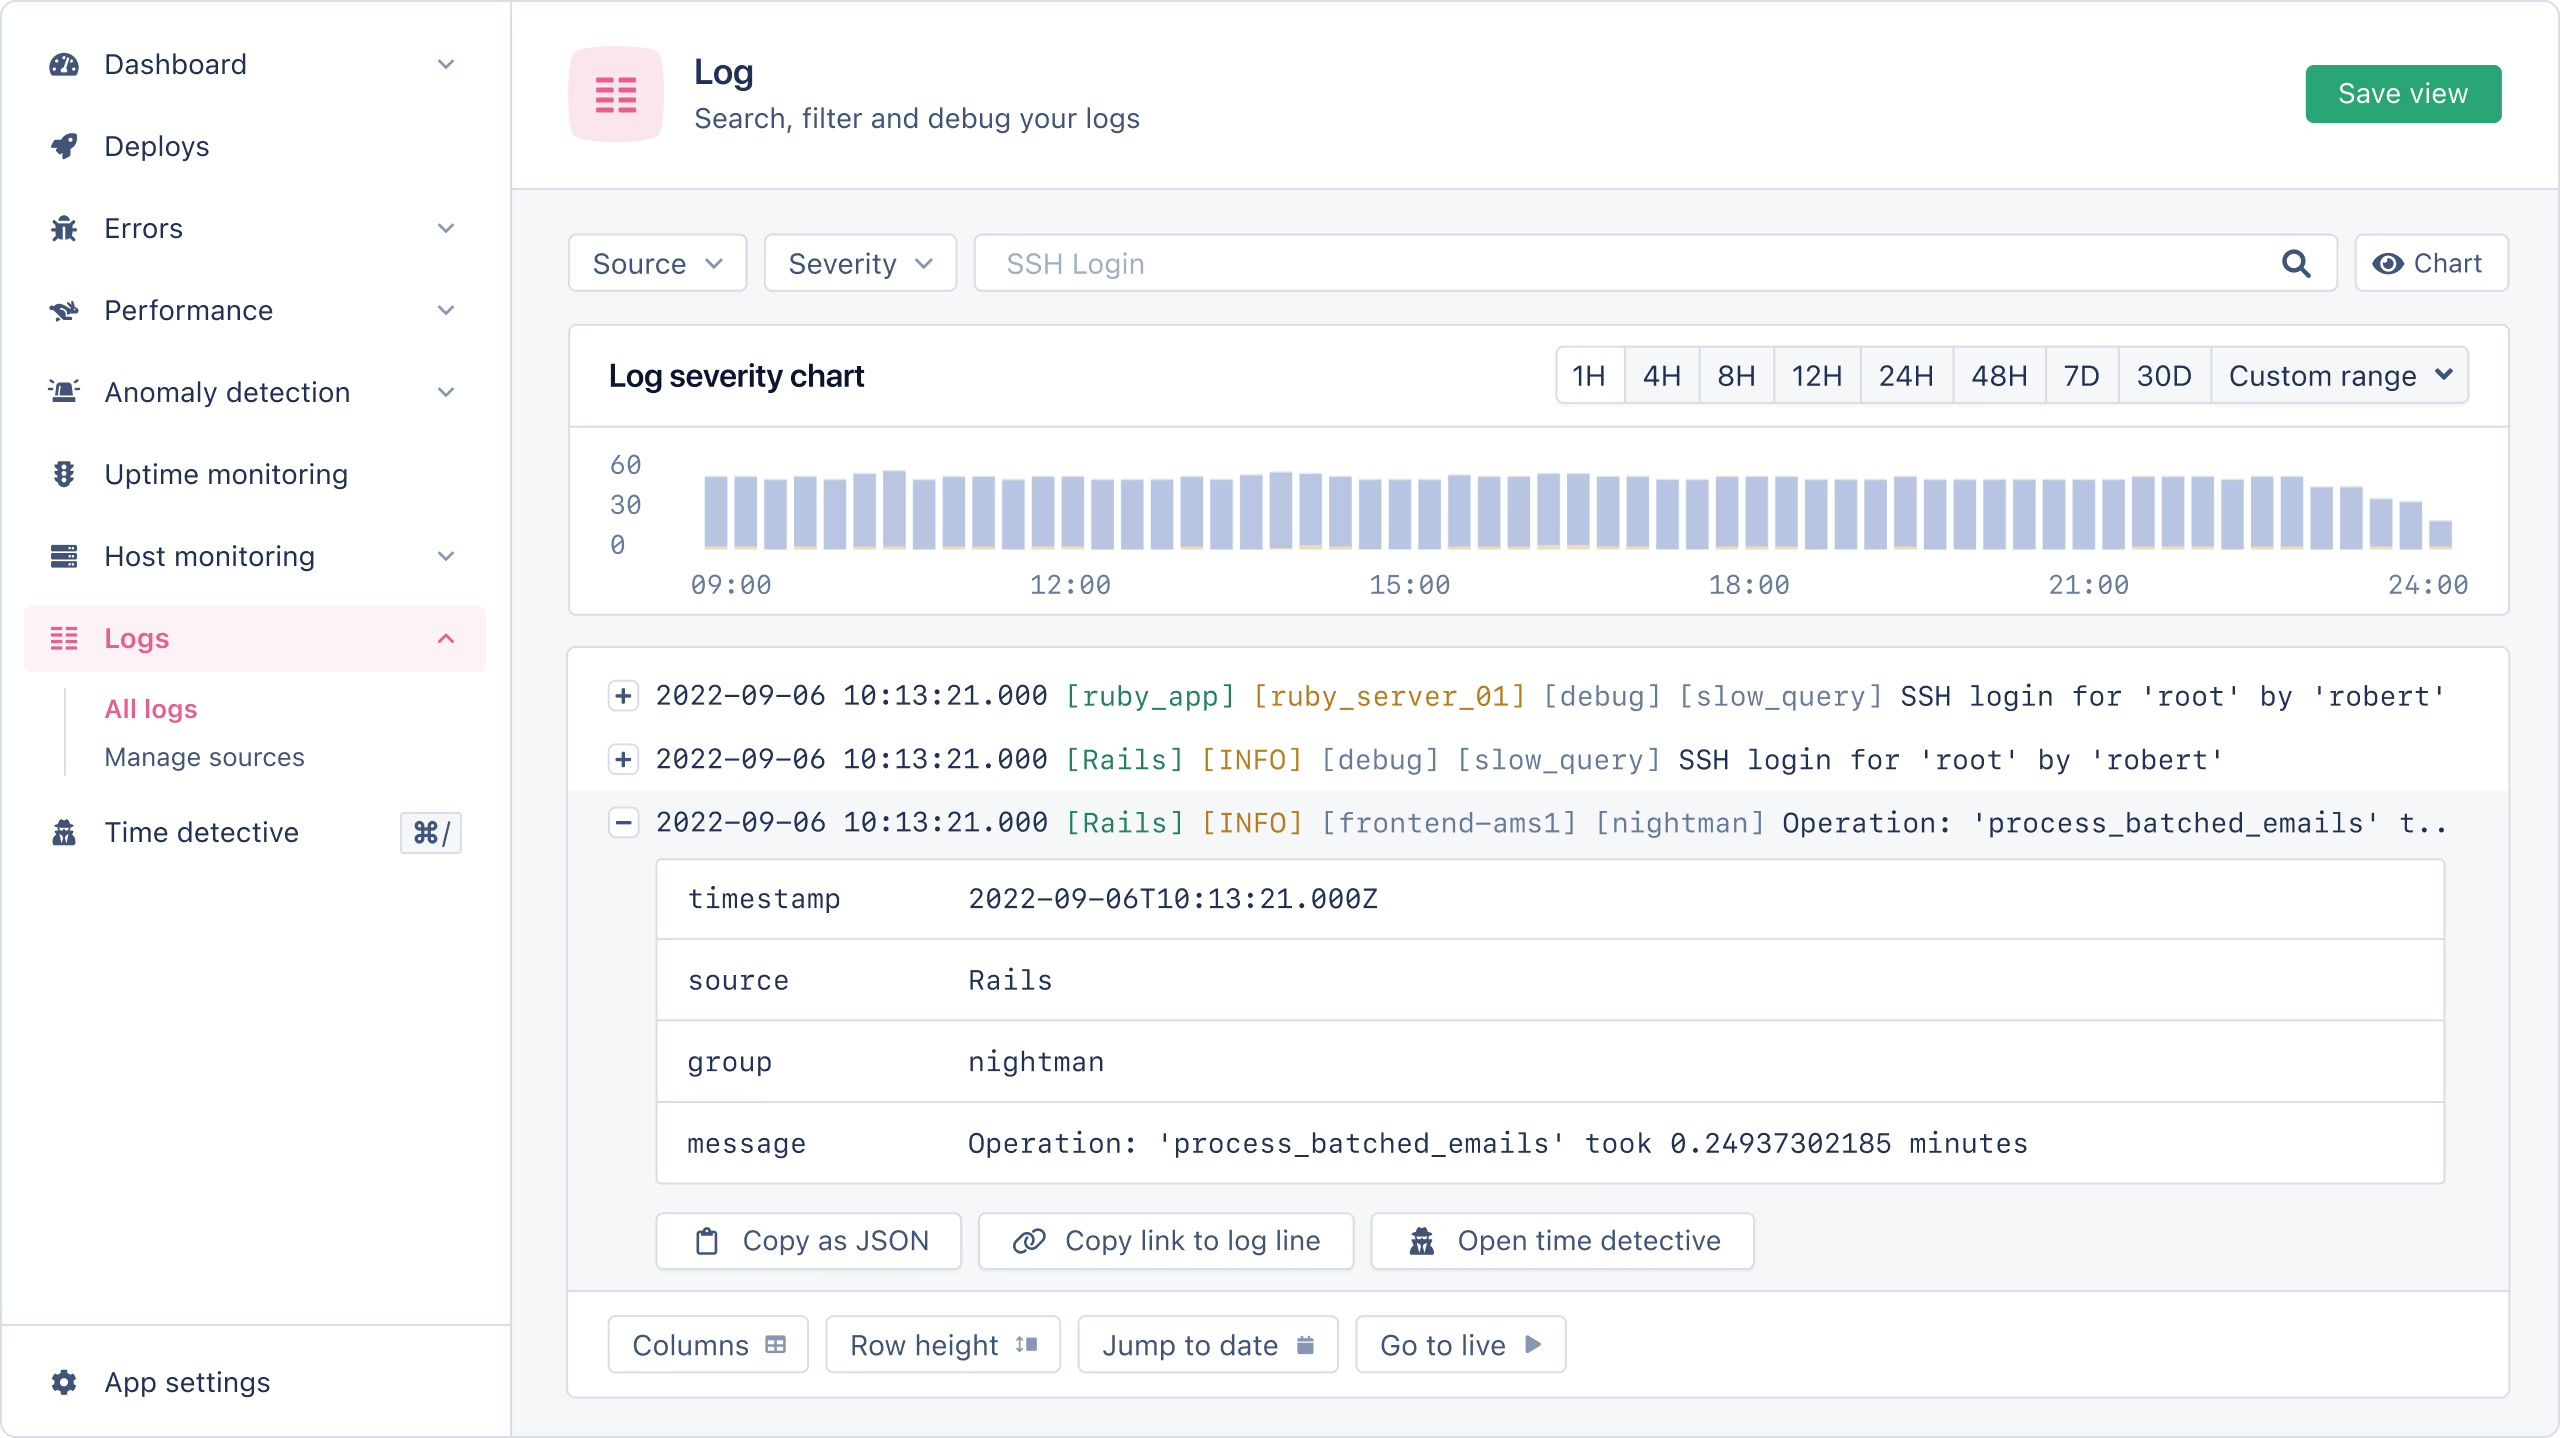
What is AppSignal?
AppSignal is an application performance monitoring (APM) and error tracking tool designed for developers. It offers insight into errors, performance issues, host metrics, uptime monitoring, and logs in one unified platform. It's known for its ease of setup, developer-friendly experience, and real-time alerting.
AppSignal isn't listed on BuiltWith, as it's largely backend focused, but organic traffic can give us a rough estimate of its popularity. Ahrefs has its monthly organic visits at 1.7k visitors per month compared to the 277k of Sentry.
Key features
🚀 Error tracking: Capture exceptions, get alerts, and debug with full request details for your favorite languages like Ruby, Elixir, Python, and more.
📊 Performance monitoring: Track response times, slow queries, background jobs, and memory leaks. Find and fix bottlenecks.
🖥 Host monitoring: Monitor CPU, disk, network, and memory usage across your infrastructure. Compare hosts to see which ones are underperforming.
⚡ Anomaly detection: Get real-time alerts for any metric or unusual patterns in app behavior from any of the above sources.
🔍 Log management: Store and search logs with a clean and intuitive UI. Ingest from any source.
How does AppSignal compare to Sentry?
| AppSignal | Sentry | |
Self-serve Free to try, no mandatory sales calls | ✔ | ✔ |
Free tier Free forever option, no credit card required | ✖ | ✔ |
Error tracking Capture errors and exceptions, provide stack traces to debug issues | ✔ | ✔ |
Performance monitoring Monitor the performance of your app, including request latency, resource usage, and more | ✔ | ✔ |
Distributed tracing Follow a request across services to identify latency bottlenecks and inter-service dependencies. | ✖ | ✔ |
Profiling Capture detailed CPU, memory, and function-level performance metrics to pinpoint inefficient code segments. | ✔ | ✔ |
Alerting Detect and receive notifications when problems arise | ✔ | ✔ |
Release tracking Associate errors and performance issues with specific deployments | ✔ | ✔ |
Log management Aggregate and analyze logs in real-time to correlate events, identify issues, and gain insight into system performance. | ✔ | ✖ |
Product analytics Custom events, trends, funnels, paths, and retention | ✖ | ✖ |
Session replay Watch real users on your site; discover friction points | ✖ | ✔ |
Surveys Collect feedback and run satisfaction surveys | ✖ | Feedback only |
Governance Audit log, roles-based access, permissions | Permissions | Audit log, permissions |
Open source Audit code, contribute to roadmap, and build integrations | ✖ | ✔ |
EU hosting Store your data in the EU for compliance | ✔ | ✔ |
Why do companies use AppSignal?
According to reviews on G2, AppSignal is praised for:
Language-focus: Reviewers appreciate AppSignal's support for their favorite languages, like Ruby and Elixir. They say it makes it easier to integrate AppSignal into their existing product.
Ease-of-use: AppSignal is easy to set up and use. It has a bunch of pre-built metrics and visualizations for monitoring their app.
Bottom line
For developers using one of the languages AppSignal supports, it's a great alternative to Sentry. Although their lack of a free tier might be a dealbreaker for some.
Is PostHog right for you?
Here's the (short) sales pitch.
We're biased, obviously, but we think PostHog is the perfect Sentry replacement if:
- You value transparency. We're open source and open core.
- You want all the tools to help you build a better product (like product analytics, session replays, and A/B testing).
- You want to try before you buy. We're self-serve with a generous free tier.
Check out error tracking install guide and read our docs to learn more.